/MAIN IMAGE.jpg)
WERT-60/120/4B 2D Resitivity Imaging System
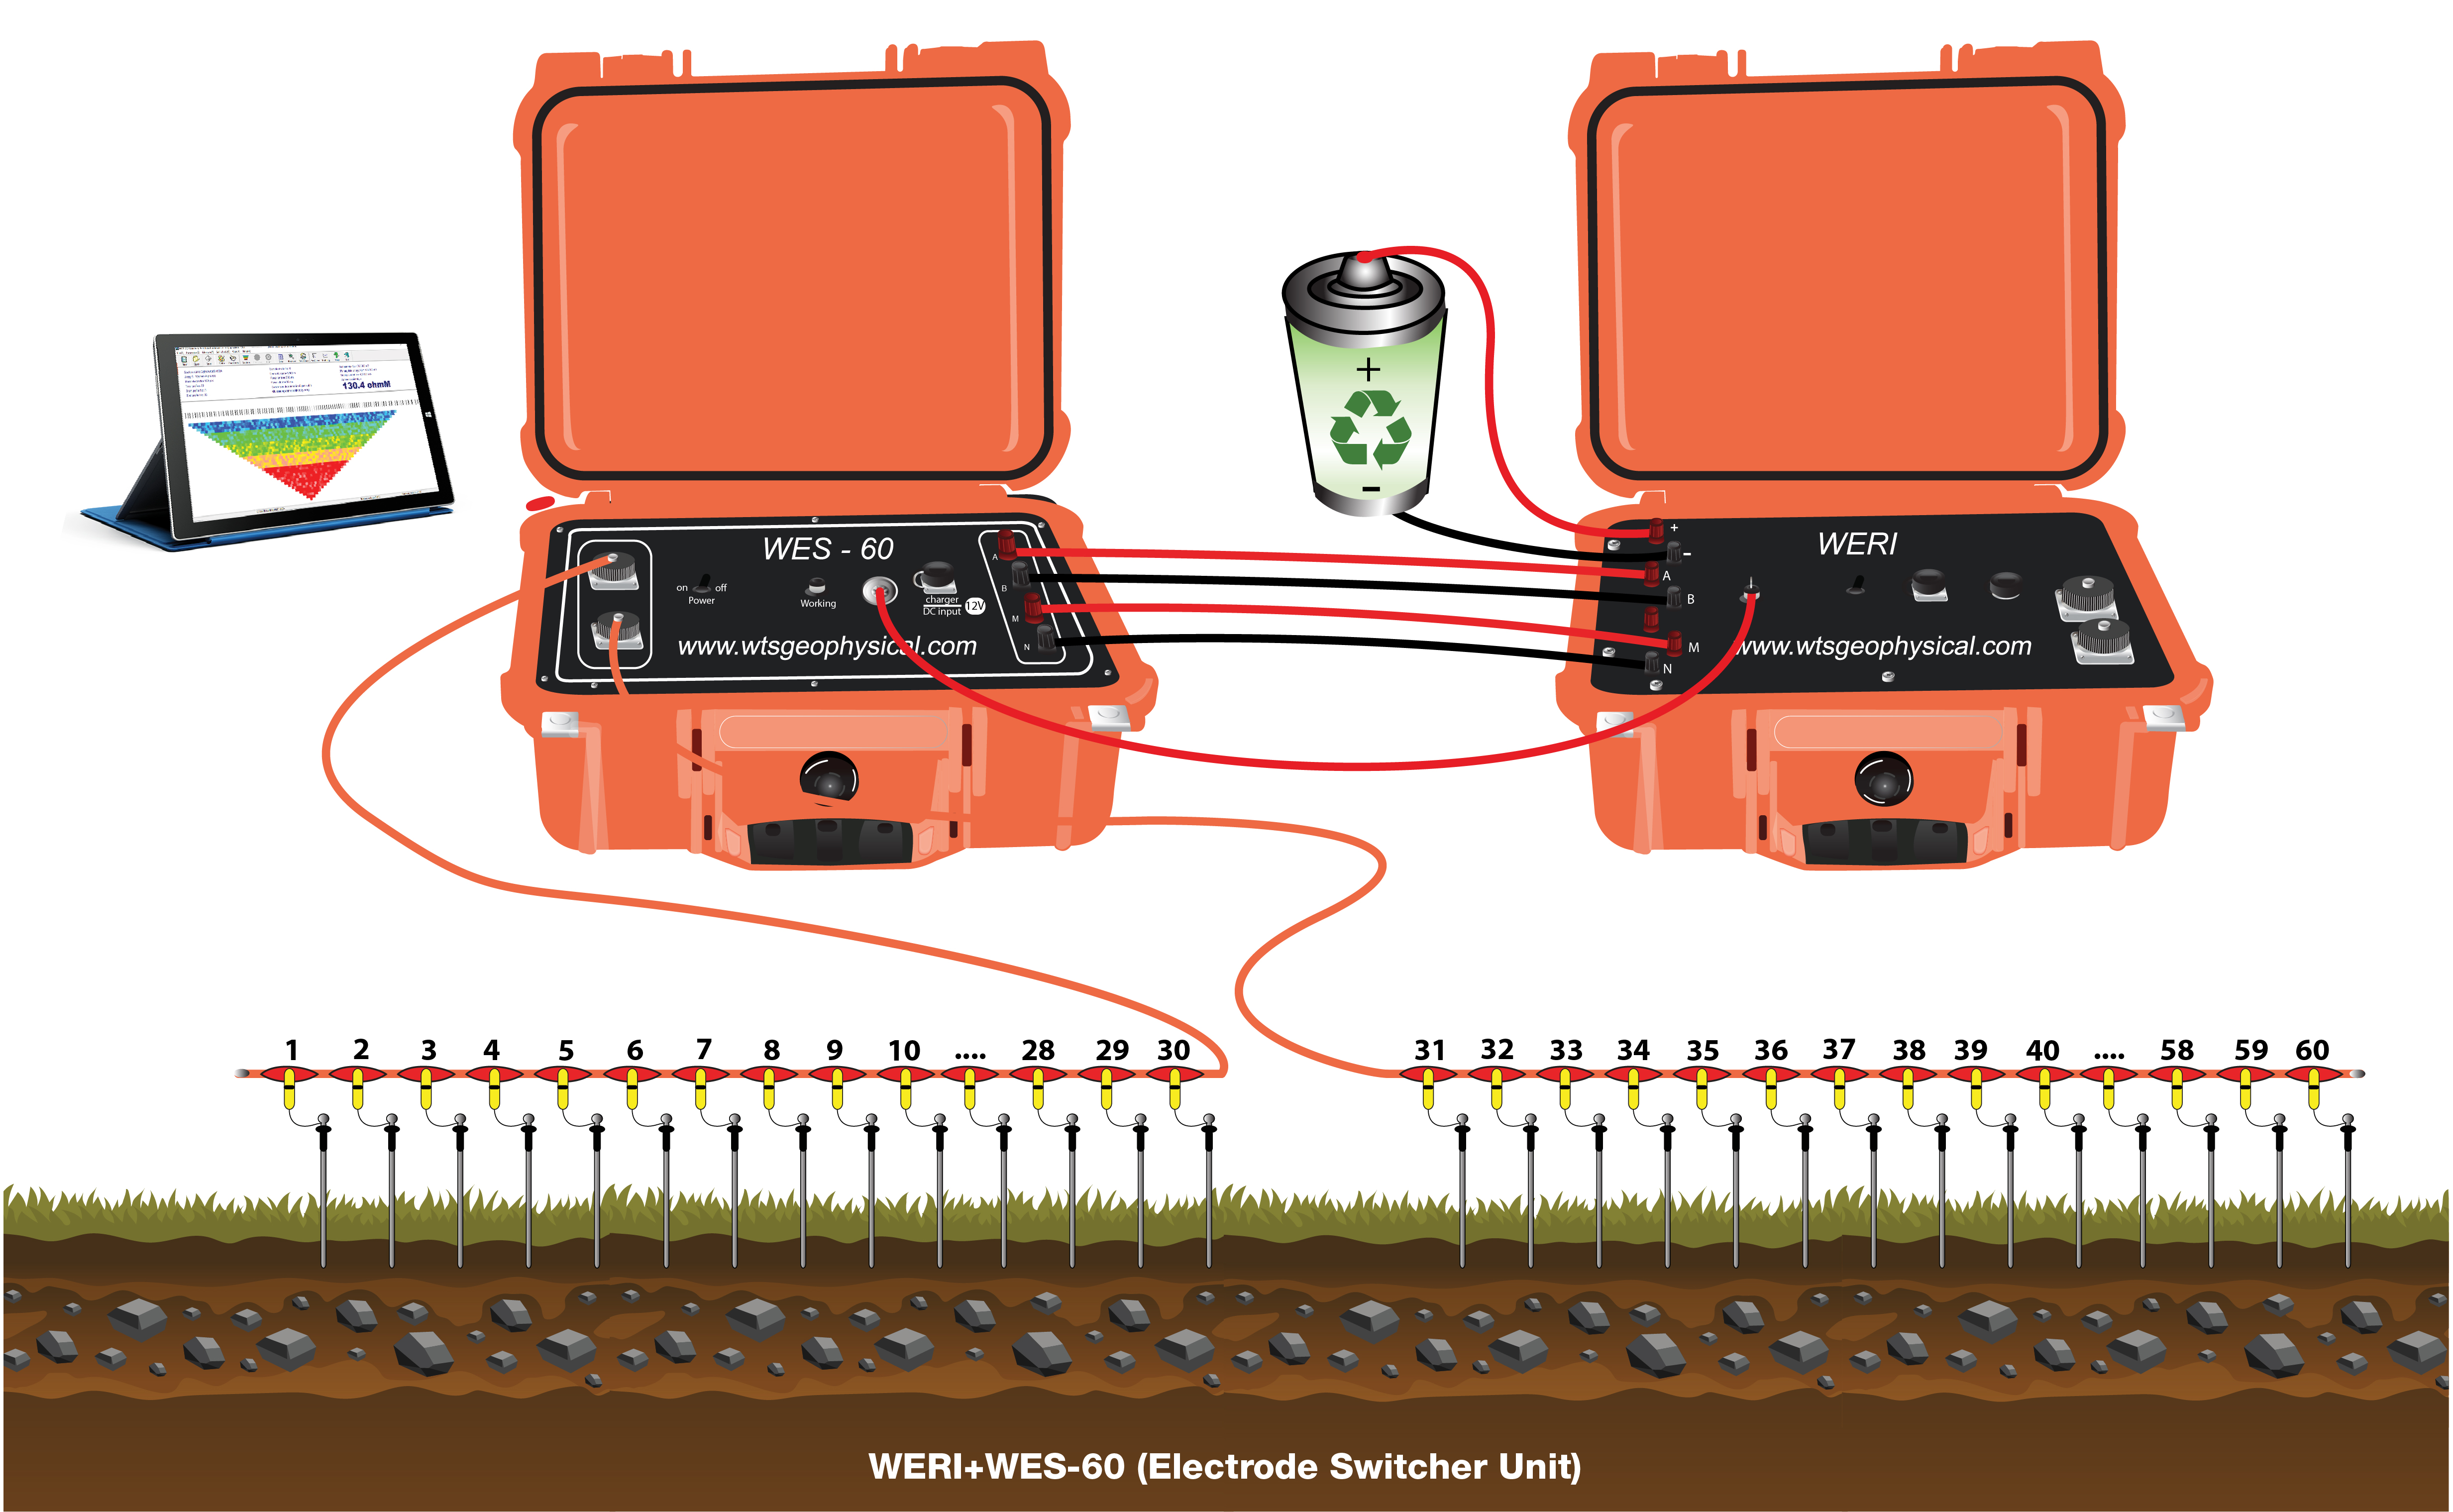
WERT Series is a new state-of-art geophysical instrument renowned for simple, economical and field friendly , ‘Centralized System ‘ for “Multi-Electrode Resistivity Imaging Survey”. It has multiple functions such as high accuracy, quick operation, high reliability, and excellent expandability. It makes field surveys more economical and comfortable. It has the coupling unit of Mainframe (WERI) and Multiplex Switcher (WERT 60/120/4B System) designed explicitly for resistivity imaging survey. Multi-Electrode Switcher is available in three configurations as a Centralized system namely WERT-60 (Supports up to 60 electrodes) ,WERT-120 (Supports up to 120 electrodes in continuous Switcher mode) and WERT-4B (Supports up to 120 electrodes in discrete switcher mode) respectively. WERT -60/120/4B arrangements are compatible to work with the ‘Centralized Cable System’ (30 take-out available at 2m, 5m, 10m, and 20m standard spacing) for Resistivity Imaging /Tomography function.
In addition to above features, WERI Series mainframe has an add-on provision to advance and use with Distributed resistivity IP Imaging Cable configuration ( 10 take out Resistivity & IP Imaging Cable at 2m, 5m, and 10m standard spacing), which makes sure to develop a lengthy profile for more profound mapping of earth resources, without limitation of electrodes.
ERI is the measurement of the apparent electrical resistivity of the surface materials. During an imaging survey, the electrical current is injected into the earth through a pair of current electrodes and the potential difference between a couple of potential electrodes. The current and electrodes are generally arranged in a linear array. The apparent resistivity is the average bulk resistivity of all subsurface materials influencing the flow of current.
A typical imaging survey involves multiple such measurements of apparent resistivity with various configurations of electrode locations. Then process the data, and produce resistivity contour maps. It is to show resistivity variations along with depth and horizontal positions. Since the electrical resistivity of subsurface materials differs with their compositions and water contents, the resistivity contour maps are helpful to get a general background of the subsurface condition or find exciting targets. For instance, since soils and bedrocks generally have different resistivities, ERI can delineate soil-bedrock interfaces.
Function:
- 1-D VES, SP & IP Sounding.
- 1-D Resistivity & IP Profiling.
- 2-D Resistivity Imaging (Centralized Imaging Cable).
- 2-D Resistivity & IP Imaging (Distributed Imaging Cable).
Configuration:
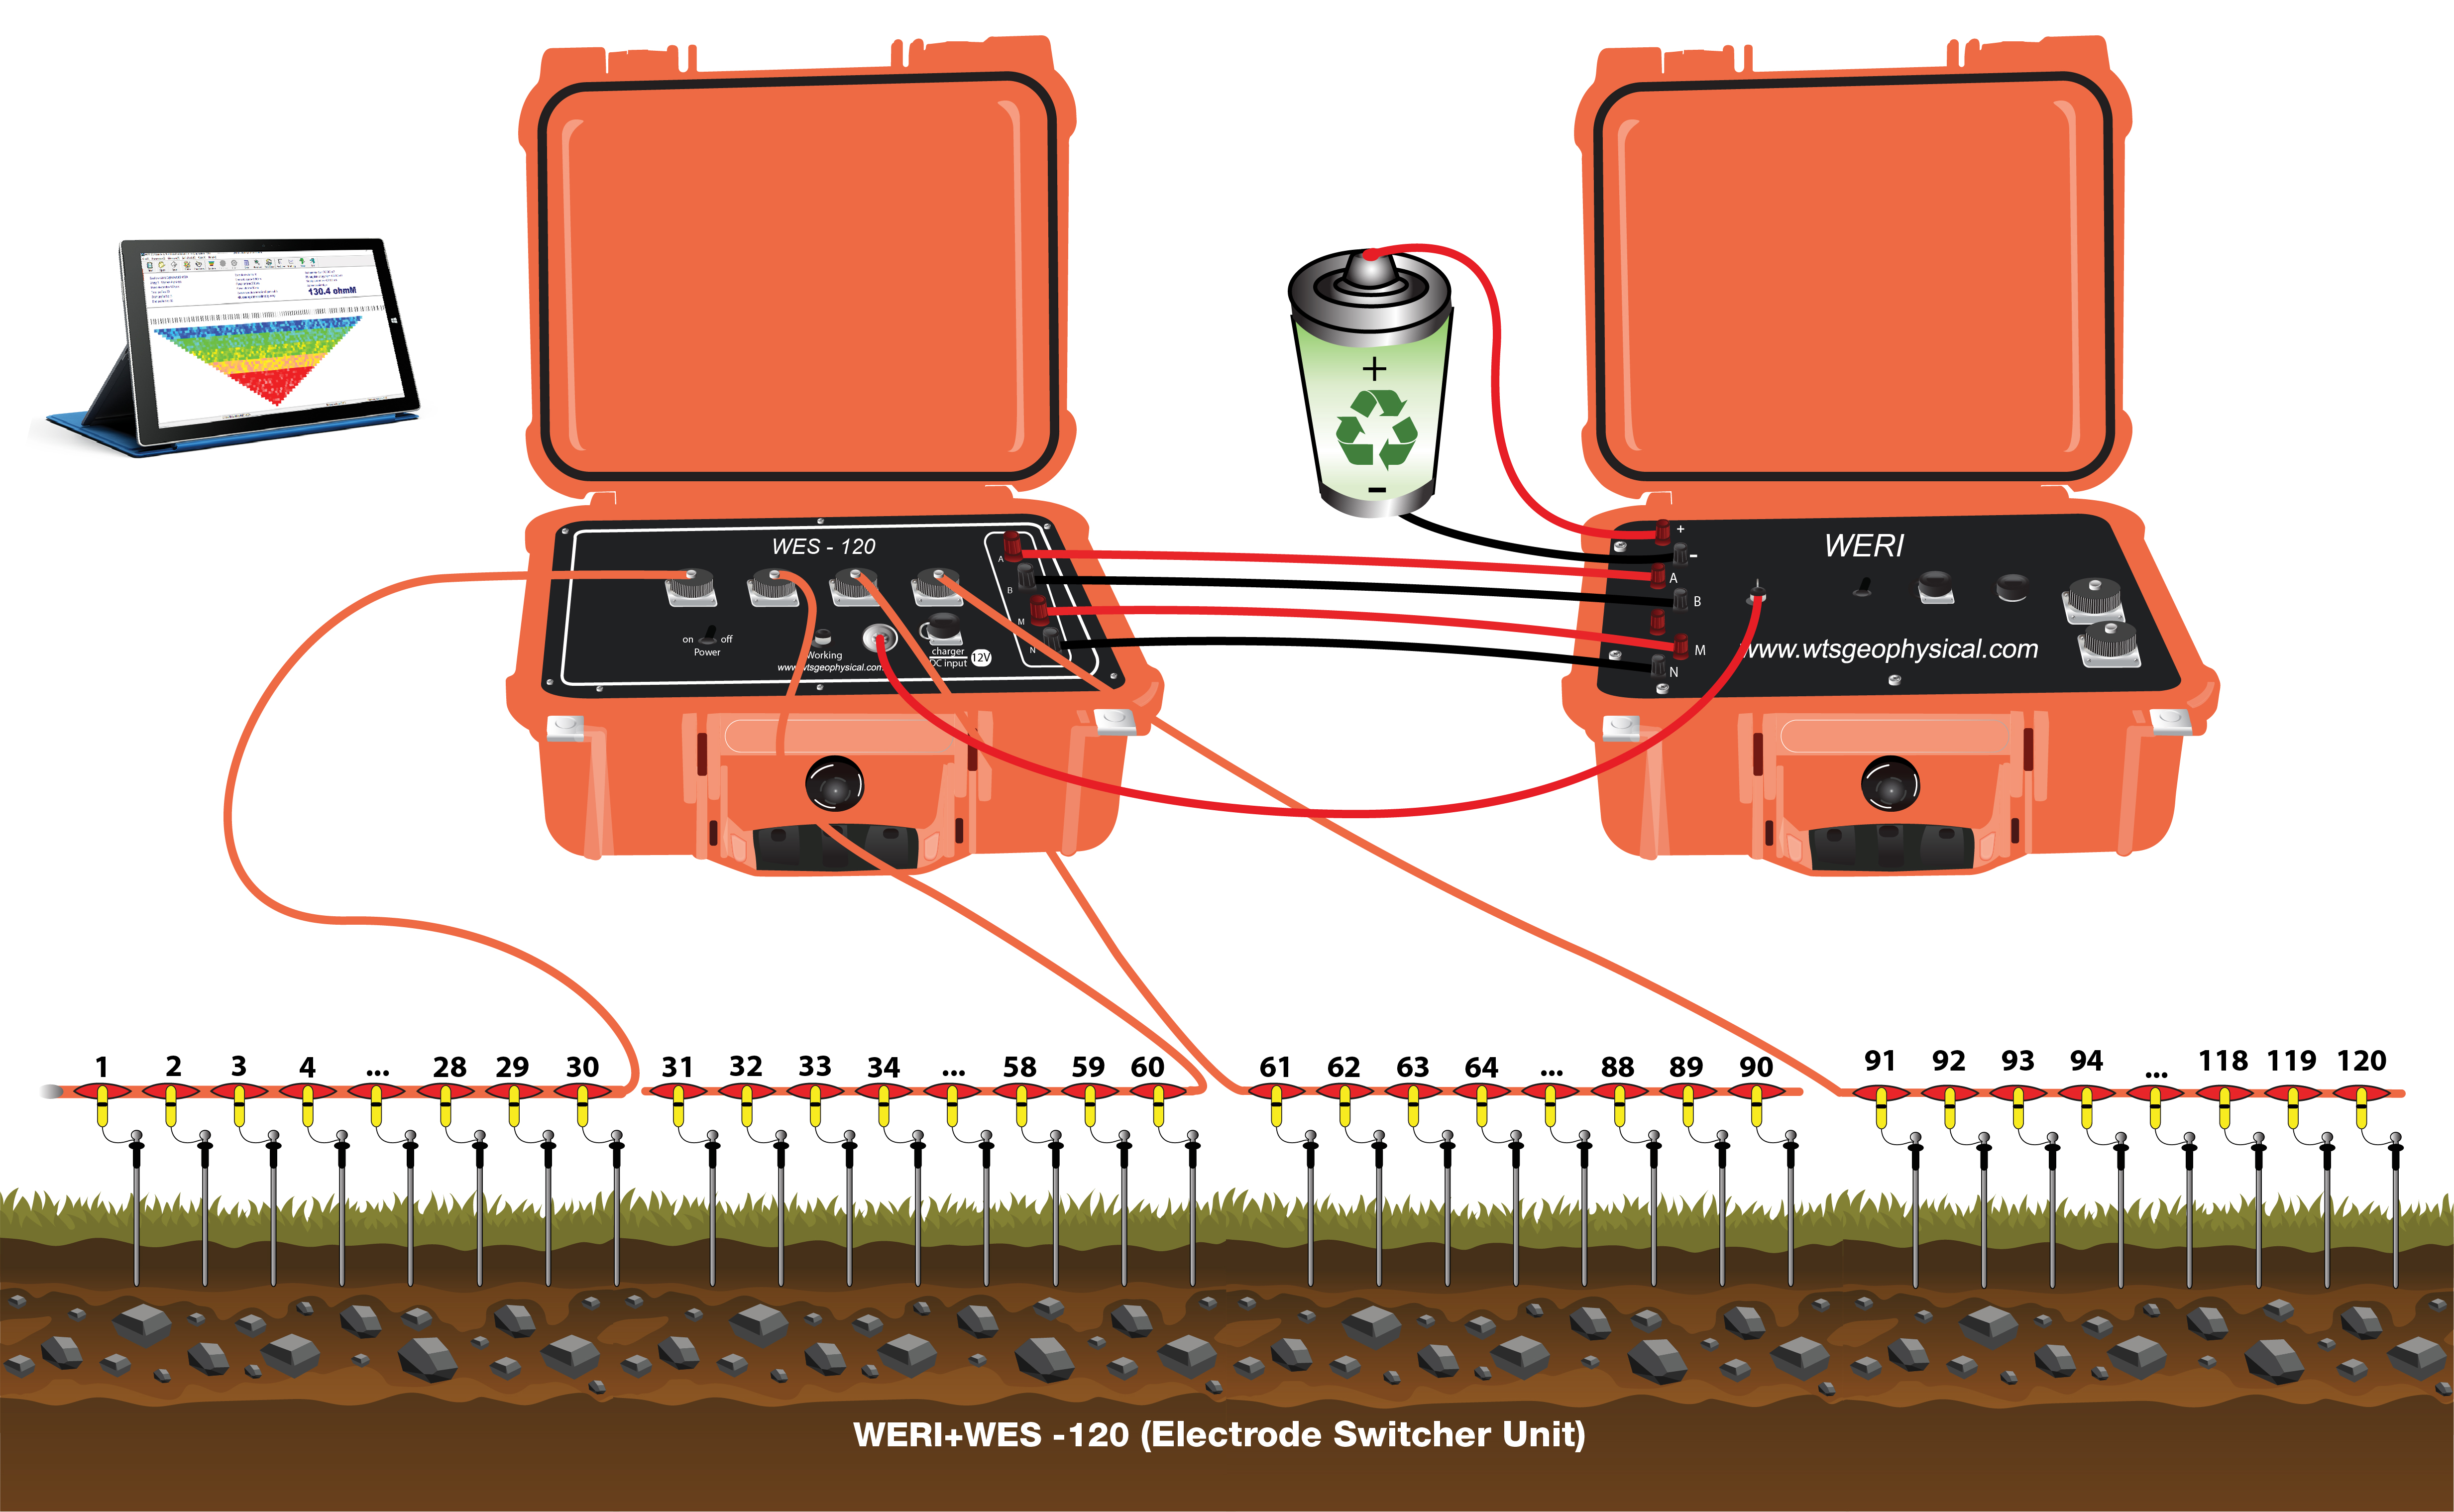
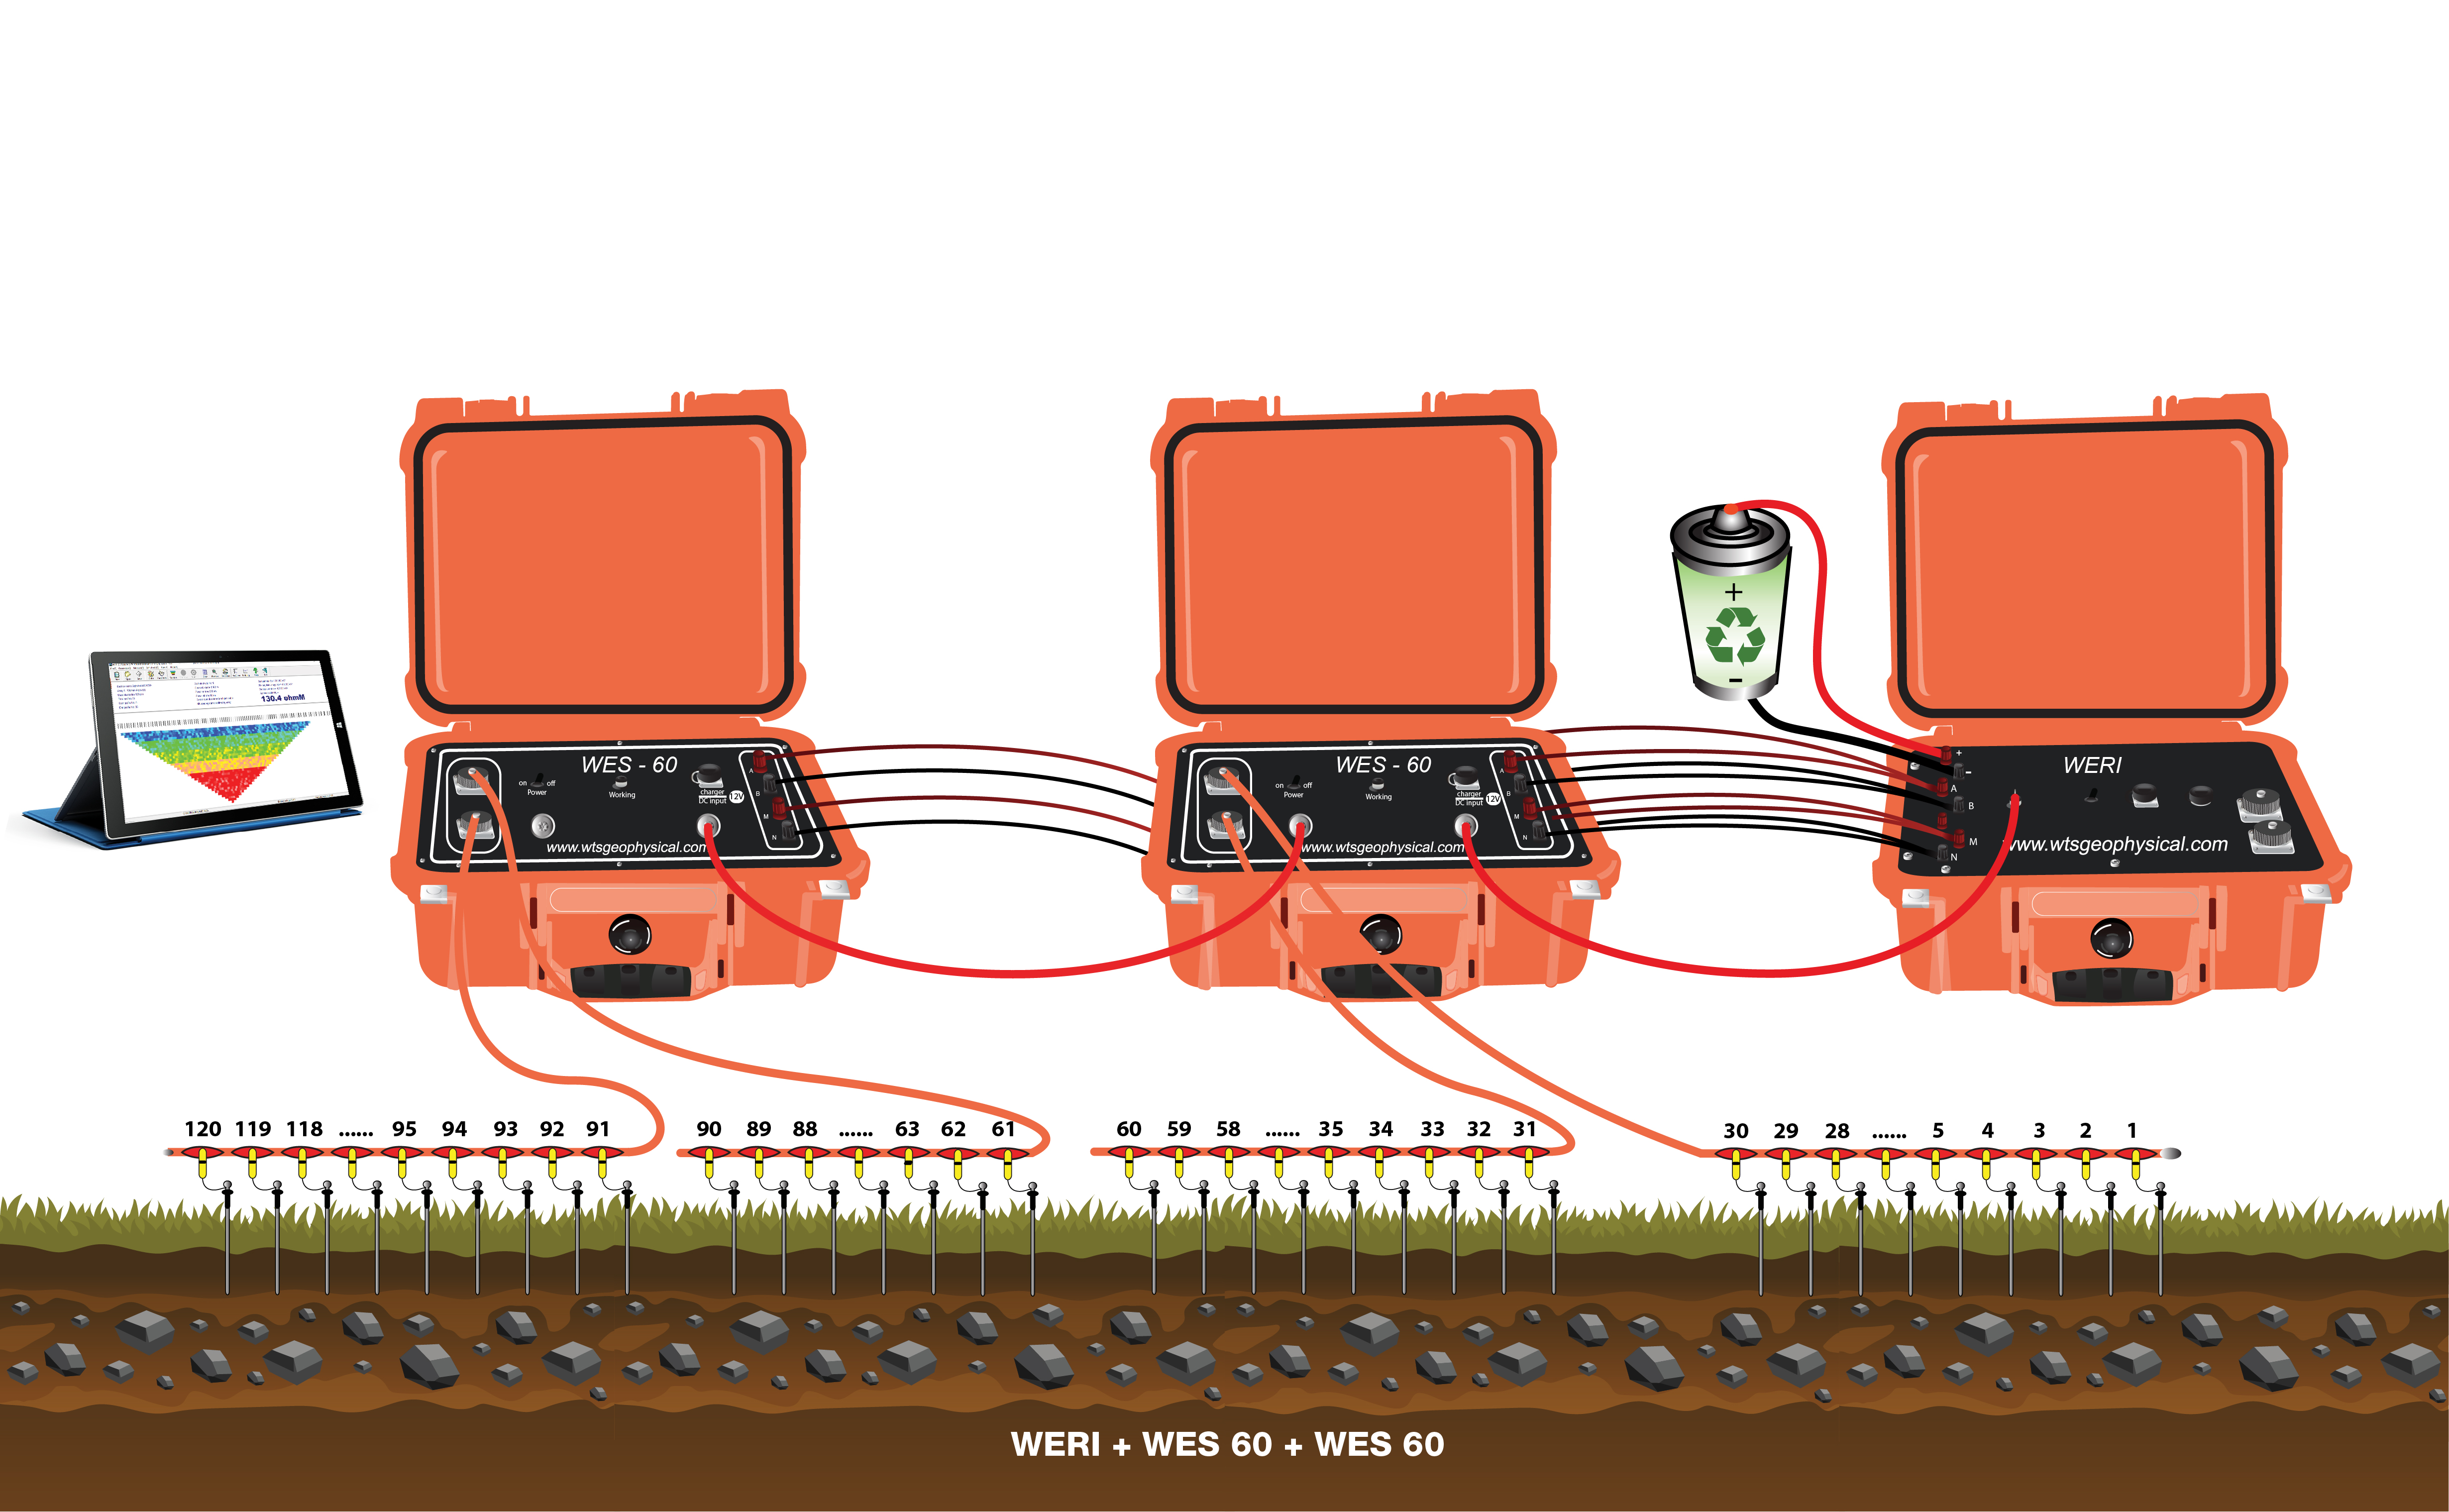
Field Layout of WERT-60
Field Layout of WERT-120
Field Layout of WERT-4B
Application:
- Hydro-geology ;for shallow and deep aquifer mapping or GW Exploration ,Water Recharge Zone Identification and Underground water inspection.
- Engineering geology for foundation study /pre-concrete structure identification & lithology mapping.
- Soil piping or Tunnel erosion study , karst and void investigation.
- Land subsidence and Landslide geometry mapping.
- Environment site assessment.
- Saline Intrusion study for delineation of fresh water and saline zone.
- Dam seepage study.
- Metal and Non-metal mineral resources detection.
- City geophysical exploration, railway and bridge inspection.
- Hydrology and engineering geology as seeking for ground water, inspecting dam base and flood protection levee for incipient faults.
- Geothermal prospecting.
- Landslides and other geological disaster exploration.
Software Analysis:
Foundation Engineering
/Software Analysis/Foundation Engineering1.jpg)
Landslide Geometry mapping
/Software Analysis/2.png)
Aquifer Mapping
/Software Analysis/3.png)
Environemental site assessment
/Software Analysis/4.png)
Features:
- Transmitting unit and receiving unit are of all-in-one design, portable and lightweight.
- Super high-power, high anti-interference performance and precision: up to 6600w (1100v×6A) power, 48Vp-p voltage range ensures to get a good result in a area with high resistance.
- Automatically achieving compensation of self-potential, drift and electrode polarization, up to ±10V.
- Receiving unit support transient over-voltage protection, transmitting unit supports over-voltage protection, over-current protection and AB open-circuit protection.
- For general resistivity and IP survey function, 9 types of electrode arrays are available. Electrode distance (namely “Program”) can be inputted or called. Geometric factor K can also be generated automatically or calculated manually.For multi-electrode 2D resistivity imaging, up to 18 electrode arrays are available. It could scanning measure according to fixed section (including AMNB, ABMN, AMBN, AMN, MNB, A-MN-B, Sp M, Sp MN, charge M, charge MN) or continuous rolling scanning measure according to variable section (including A-M, A-MN, AB-M, AB-MN, MN-B, A-MN rectangle)
- Program: the program can memorize 100 groups of electrode distances, avoiding repetitive input. Or you just input a program Id and step to call the corresponding electrode distances.
- Earth resistance inspection: ground condition can be inspected at any time.
- Mass data storage: Up to 1GB capacity (extended) enable store 5,000,000 groups measuring data (including current, voltage, SP, Ro, Ms, metal factor, TH, R, J).
- All parameter and data are under power-failure protection; and thus data will not be lost even thought the system shuts down accidentally.
- USB port enables it to transfer data to computer.
Specifications:
| Resistivity/IP Meter | |
| Receiving | |
| Voltage precision | If Vp≥10mV, ± 5‰ ± 1LSB; if Vp< 10mV, ±1% ± 1LSB. |
| Input impedance | >50MΩ |
| Apparent polarizability precision | ±1% ± 1LSB |
| SP compensation range | ±10V |
| Current channel | 6 A, ±0.4% ± 1LSB, 24 bit A/D |
| Current precision | |
| Suppression | ≥80dB for 50Hz industrial frequency (common mode interference or differential mode interference) |
| Transmitting | |
| Maximum transmitting power | 6600W (for general Res/IP sounding); 1125W (for WERT-60/120, limited by switcher box); 2400W (for WERT-4B, limited by intelligent Res cable). |
| Maximum voltage range | ± 1100V (for general Res/IP sounding); ±450V (for WERT-60/120, limited by switcher box); ±800V (for WERT-4B, limited by intelligent Res cable). |
| Maximum current range | ± 6A (for general Res/IP sounding); plusmn; 2.5A (for WERT-60/120, limited by switcher box); ± 3A (for WERT-4B, limited by intelligent Res cable). |
| Pulse width | 1~60s, duty ratio 1:1 |
| Others | |
| Display | 160 * 160 dot matrix LCD |
| Storage | ≤ 1GB |
| Working temperature | -10℃~+50℃, 95 %RH |
| Storage temperature | -20℃~+60℃ |
| Instrument power | internal 12V 9Ah rechargeable battery , lasts for 30 hours (or 12V external power supply) |
| Weight | ≤ 4.4Kg |
| Dimension (L×W×H) | 270mm * 246mm * 175mm |
| Multi-electrode Switcher | |
| Max electrode connected | 60 and 120 (for option) |
| Insulation impedance | ≥500MΩ |
| Max working voltage | 500VDC |
| Max working current | 2.5ADC |
| Power supply | Internal 7.4V 4AH rechargeable lithium battery, for continuously 25 hours |
| Working temperature | |
| Weight | 5.8Kg (for WERT-60) for WERT-120 |
| Dimension | 340mm * 295mm * 152mm (for WERT-60) 470mm * 357mm * 176mm (for WERT-120) |
| Res cable | |
| Electrode qty | 30 pcs |
| Electrode space | 5m/10m |
| Intelligent Res cable | |
| Electrode qty | 10 pcs |
| Electrode space | 5m/10m |
| Max working voltage | 800V |
| Max working current | 3A |
Accessories:
Power Source (Rechargeable with output 48v,96v,144v)
/Power Source.jpg)
2-D Resistivity Imaging cable (30 take out @ 10m spacing)
/2-D Resistivity Imaging cable.jpg)
Self -checker for cable (60 take out)
/60.jpg)
Self -checker for cable (120 take out)
/120.jpg)
Electrode with clips
/Electrode with clips.JPG)
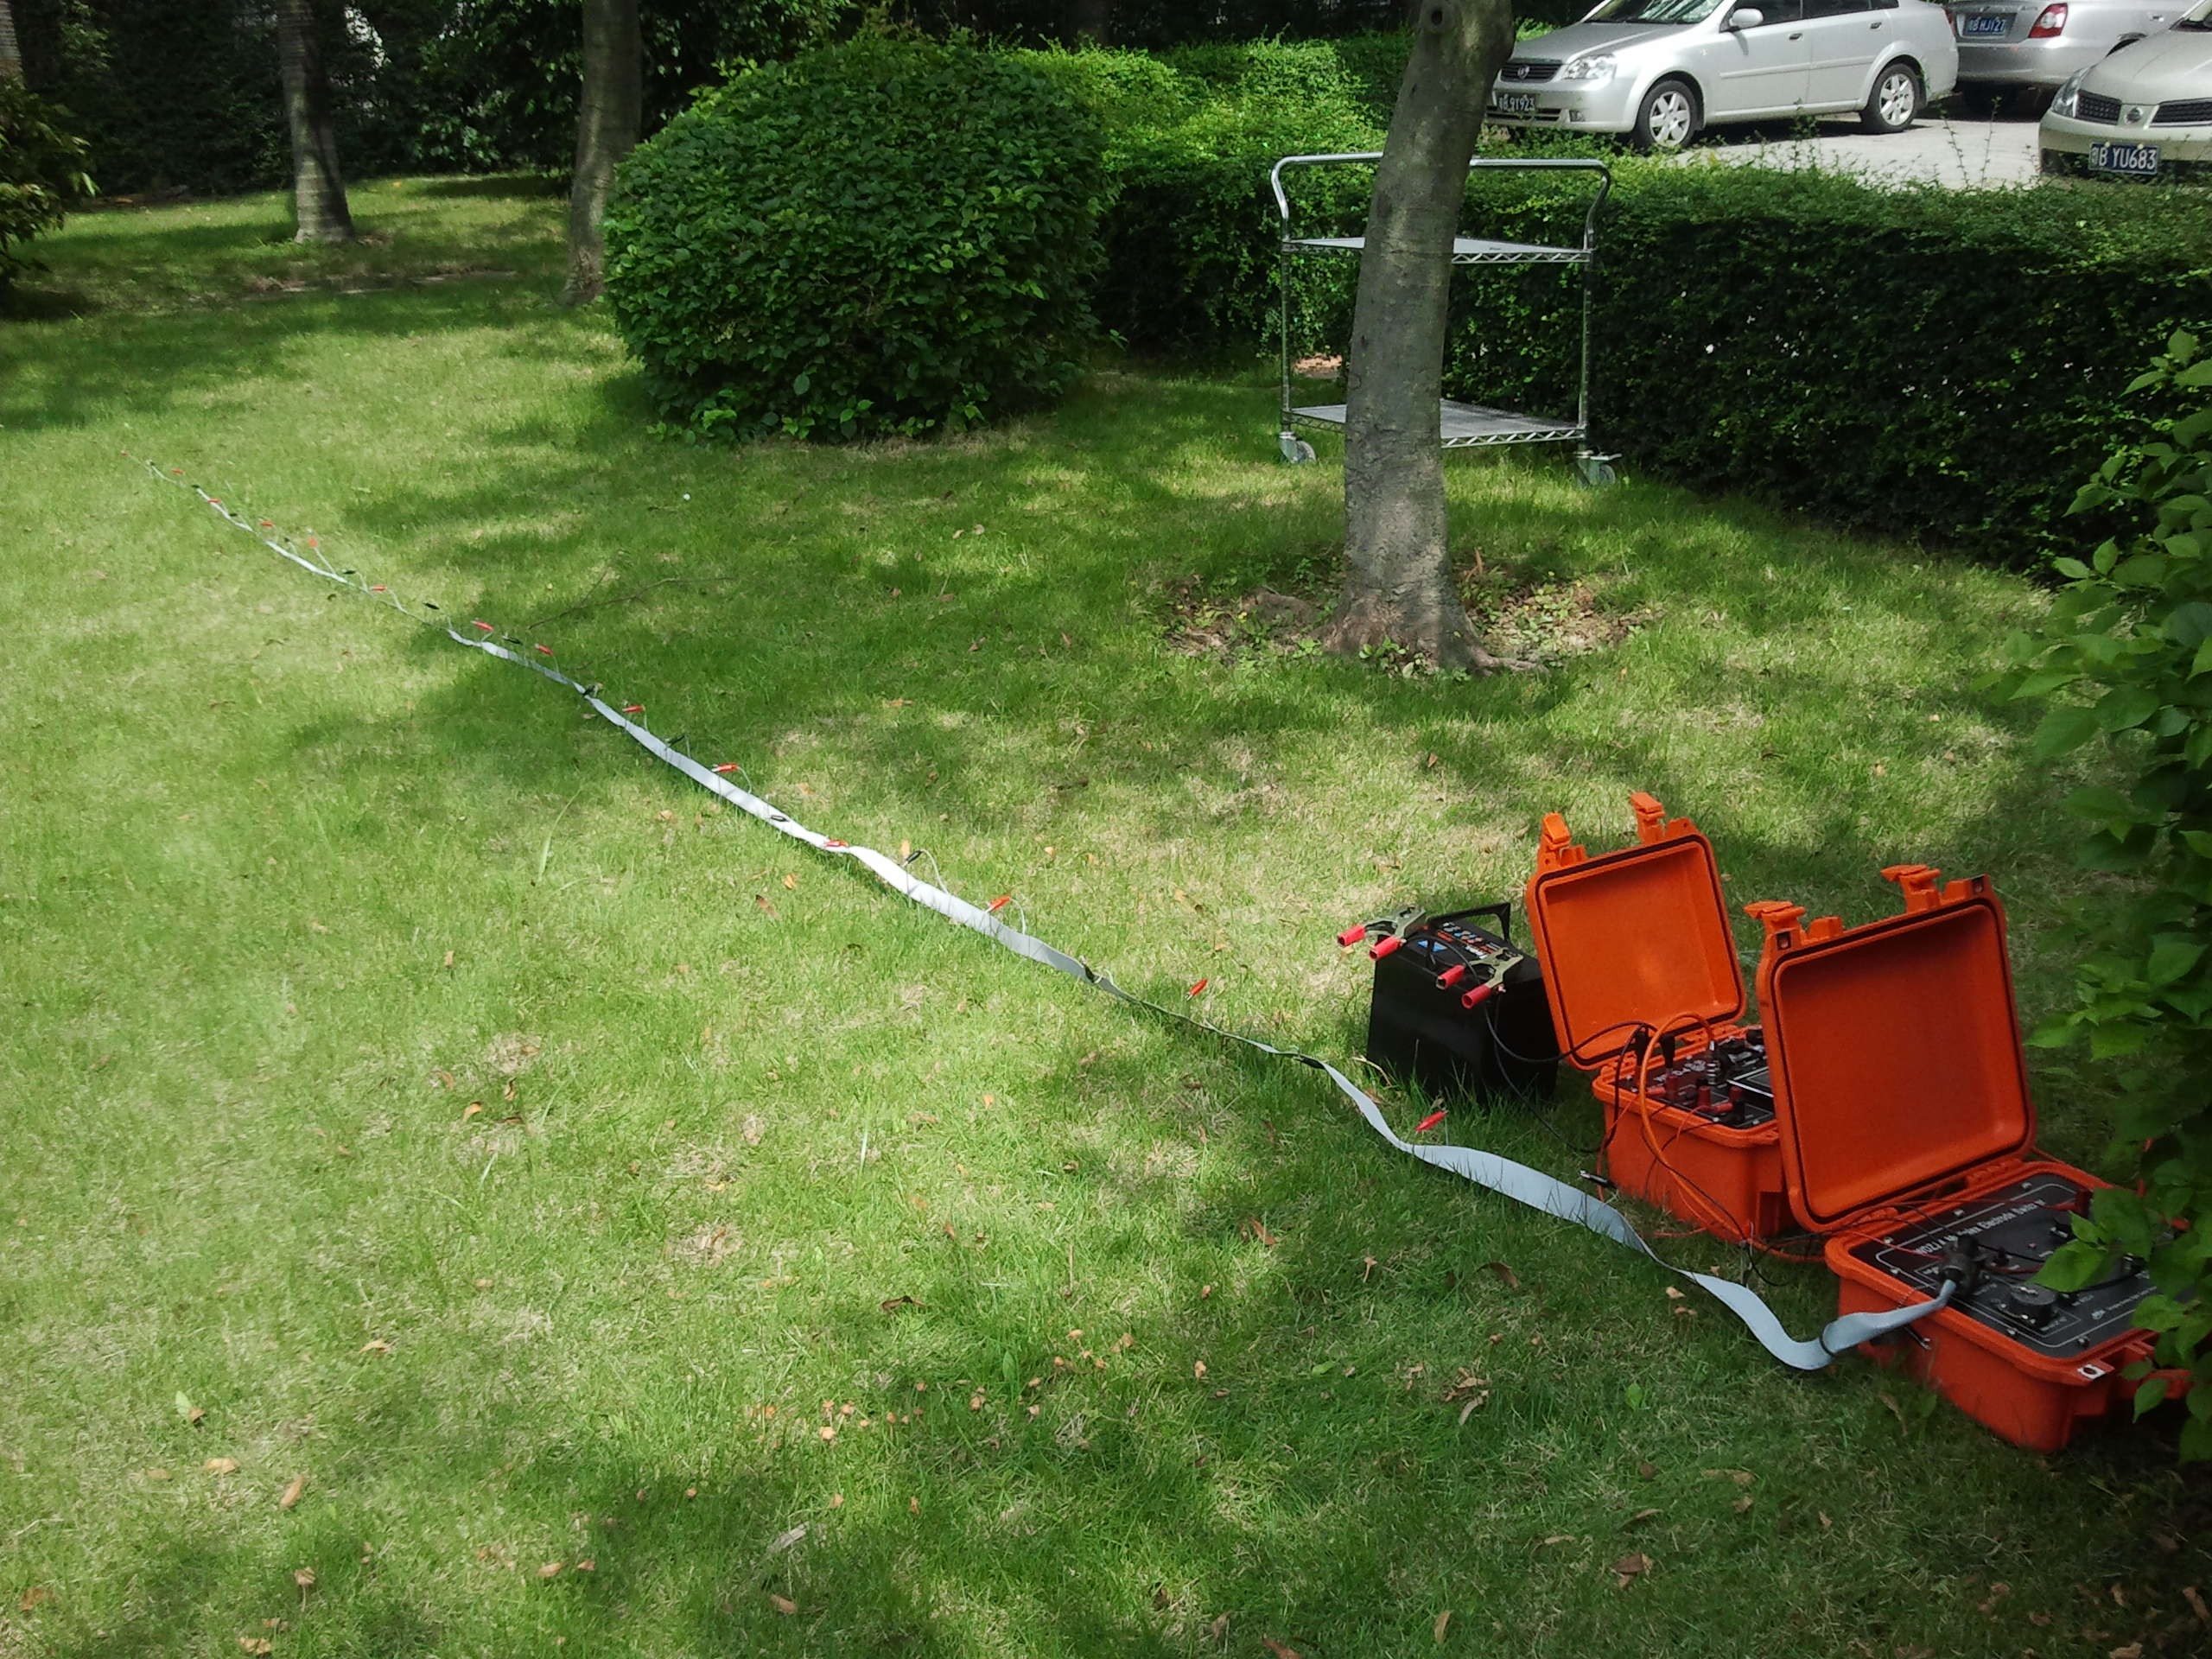
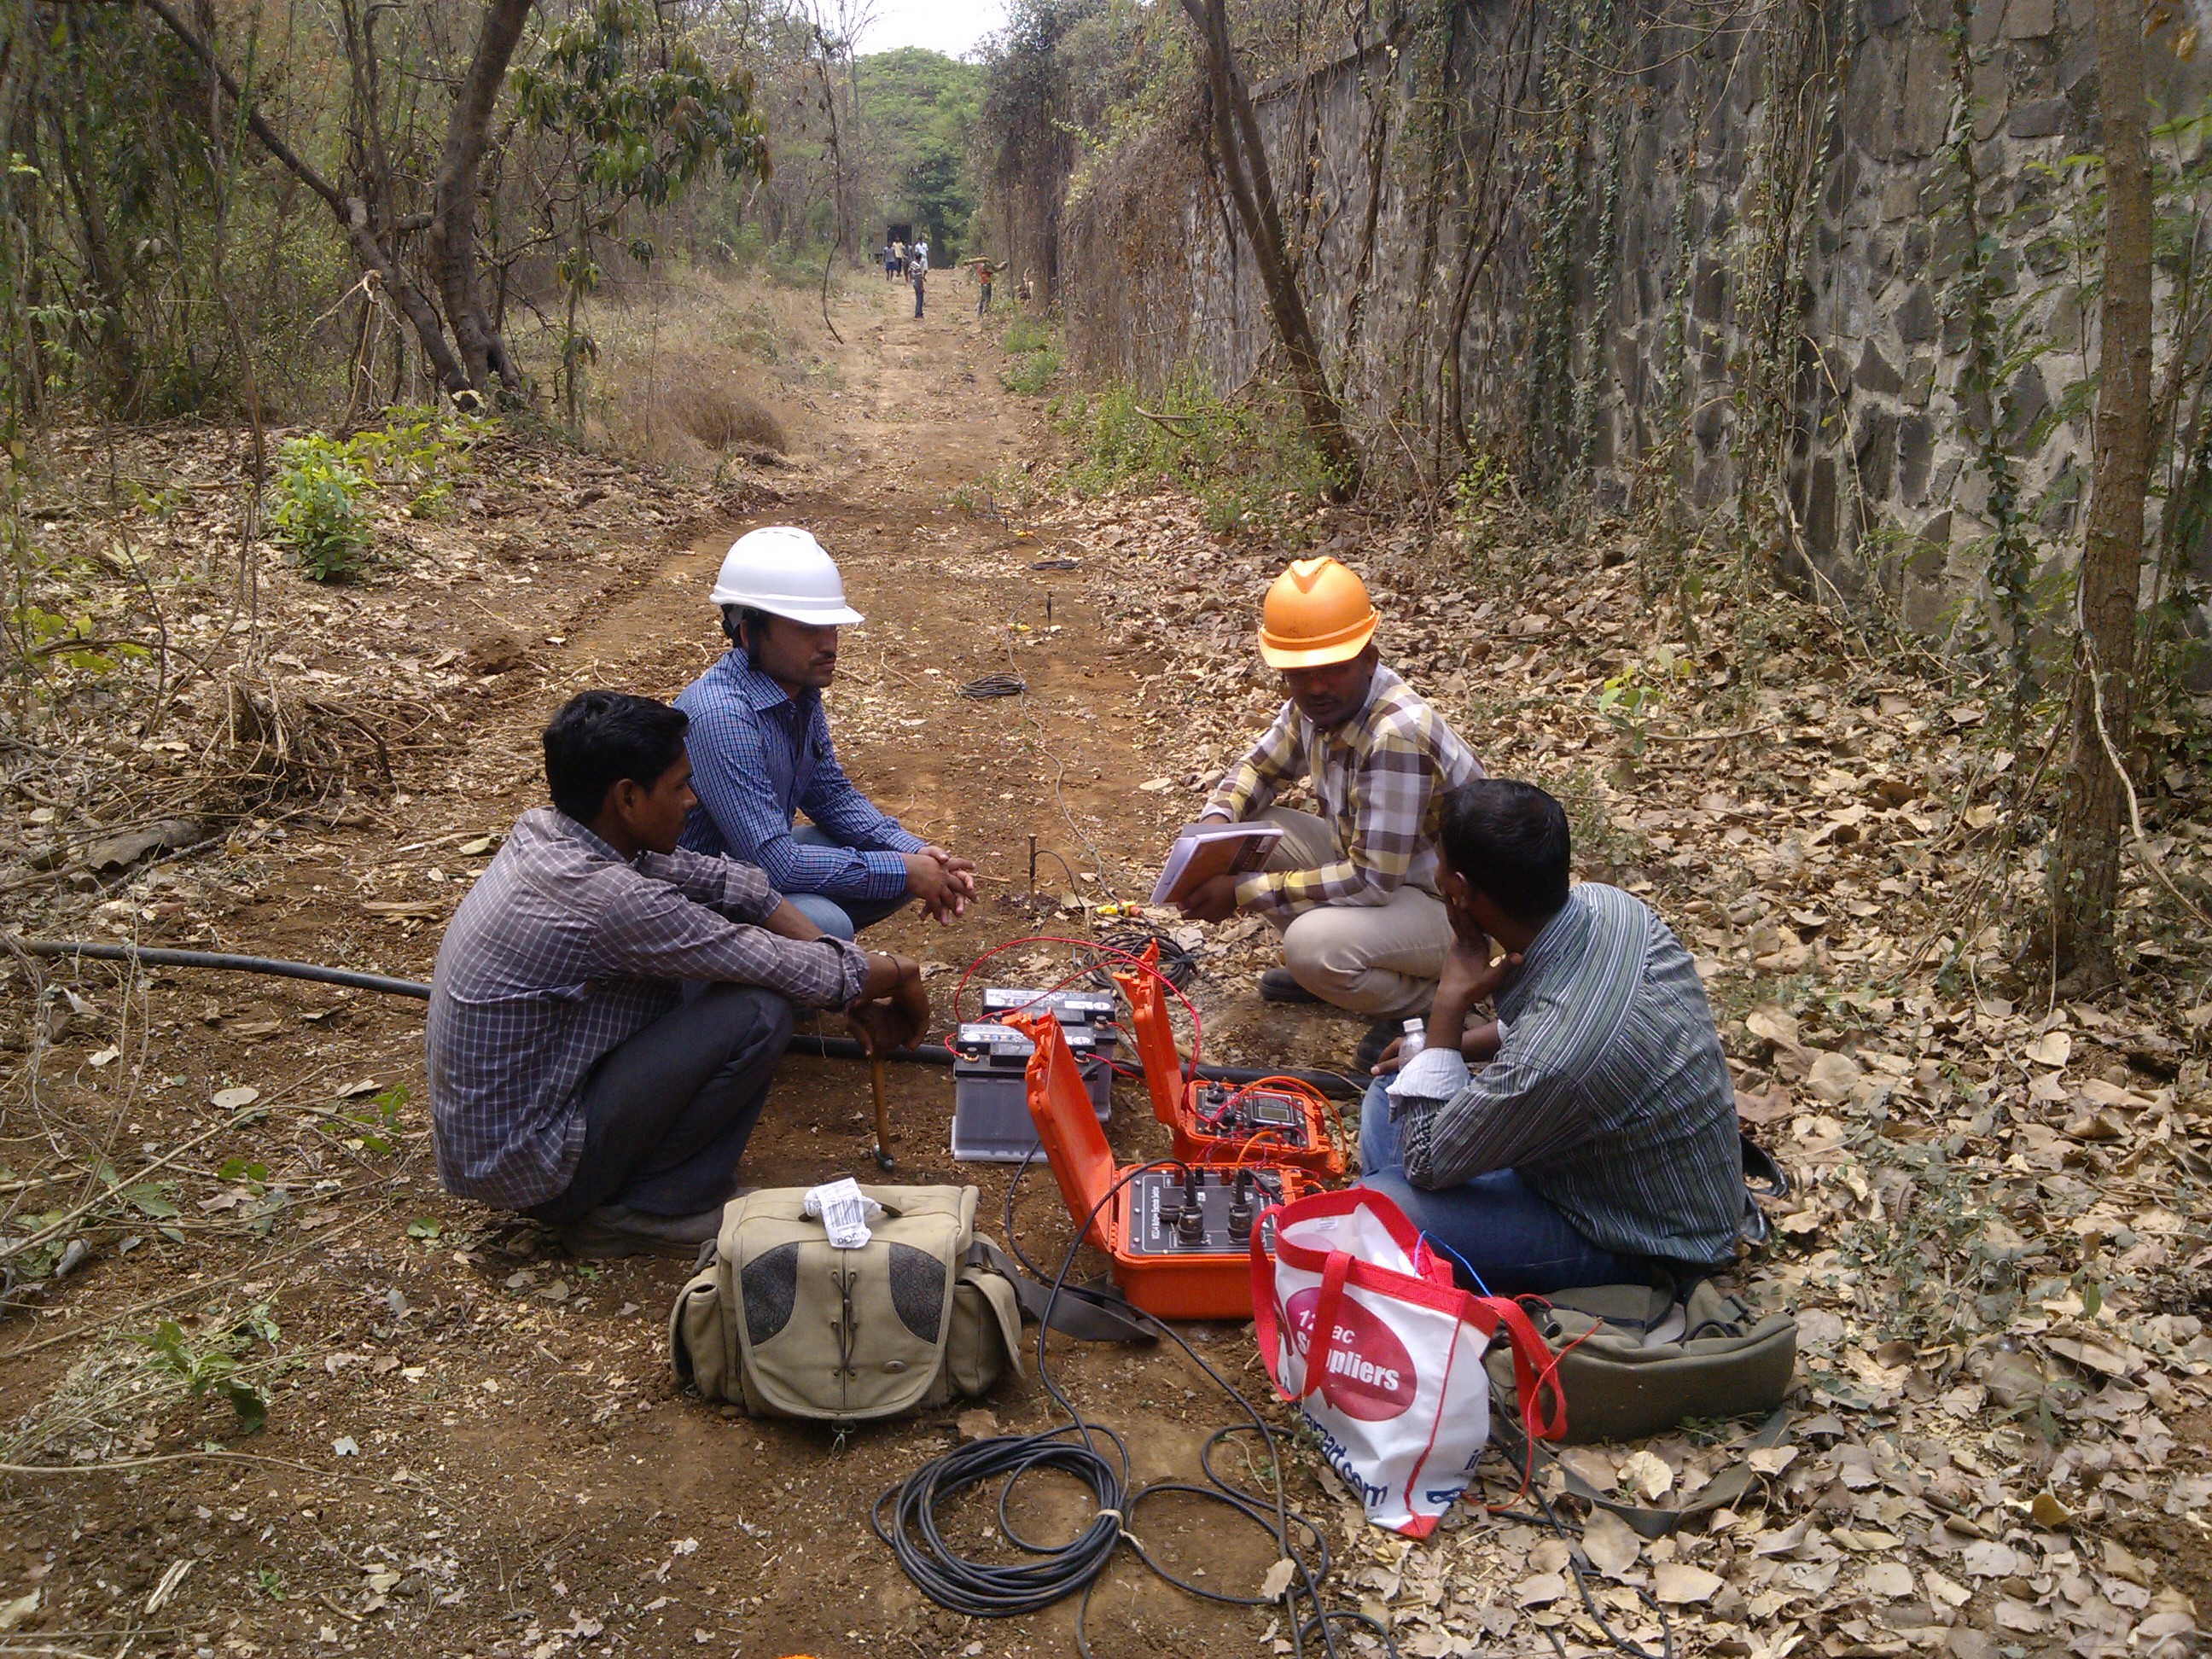
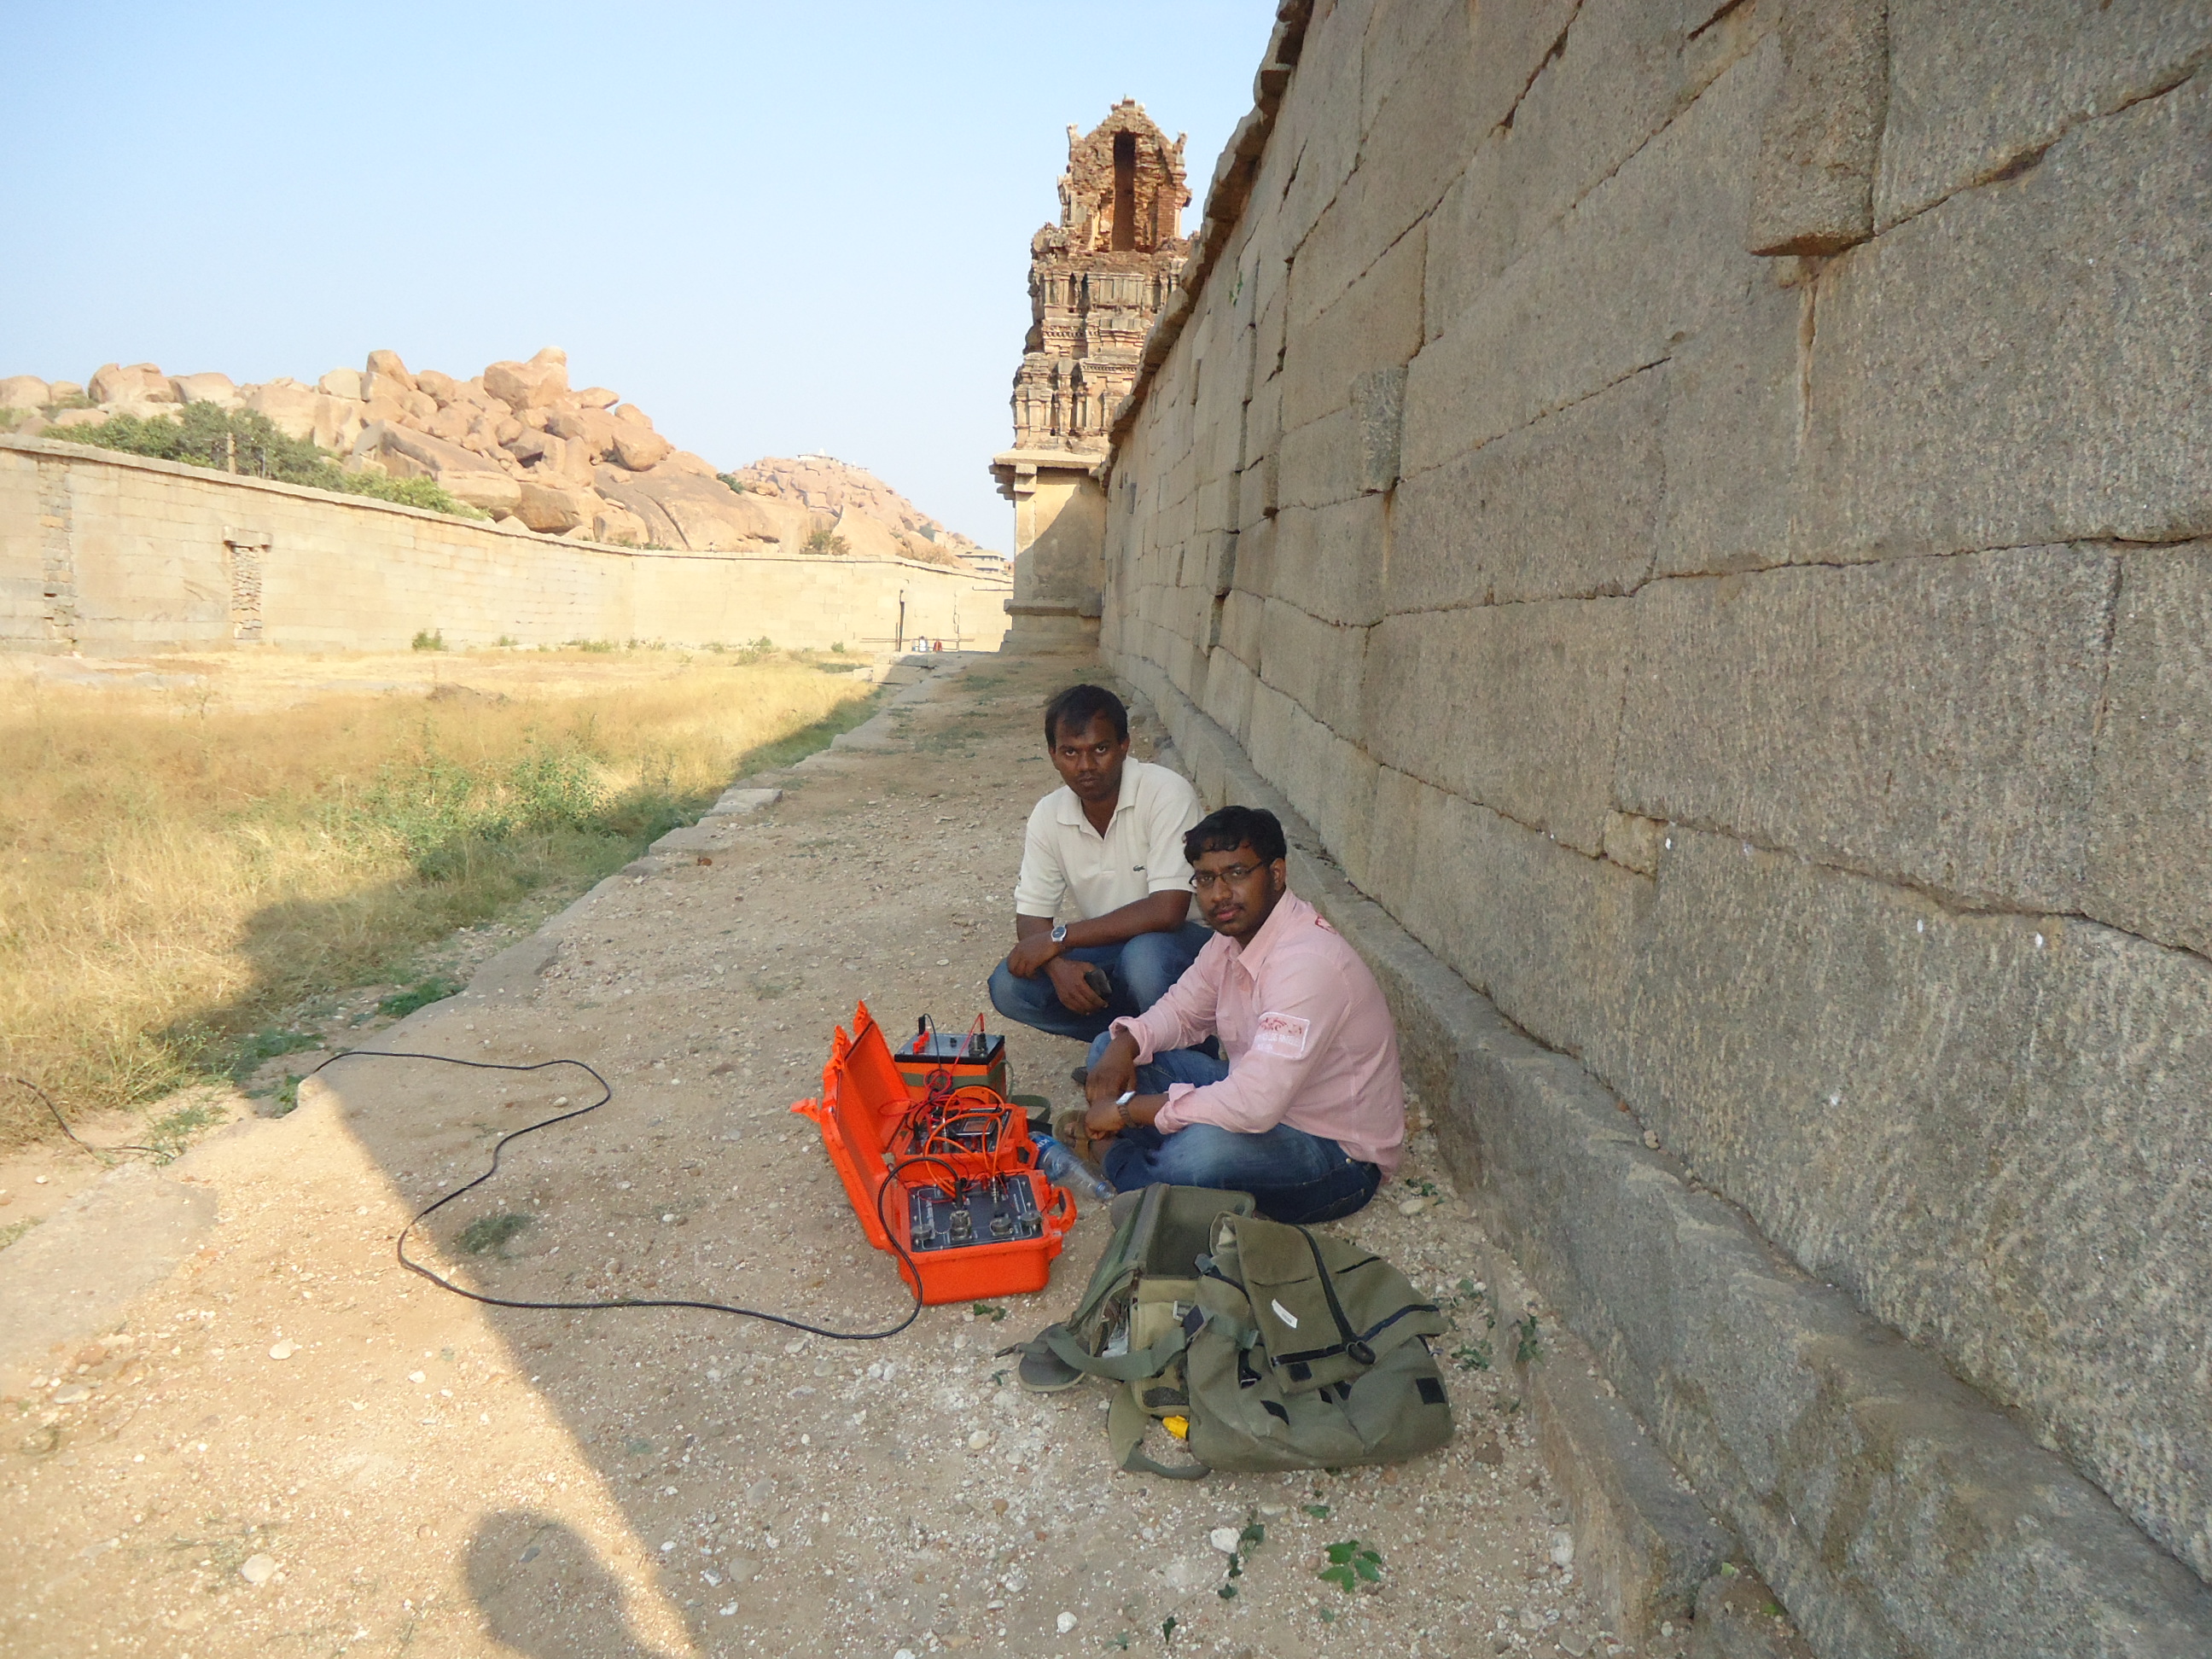
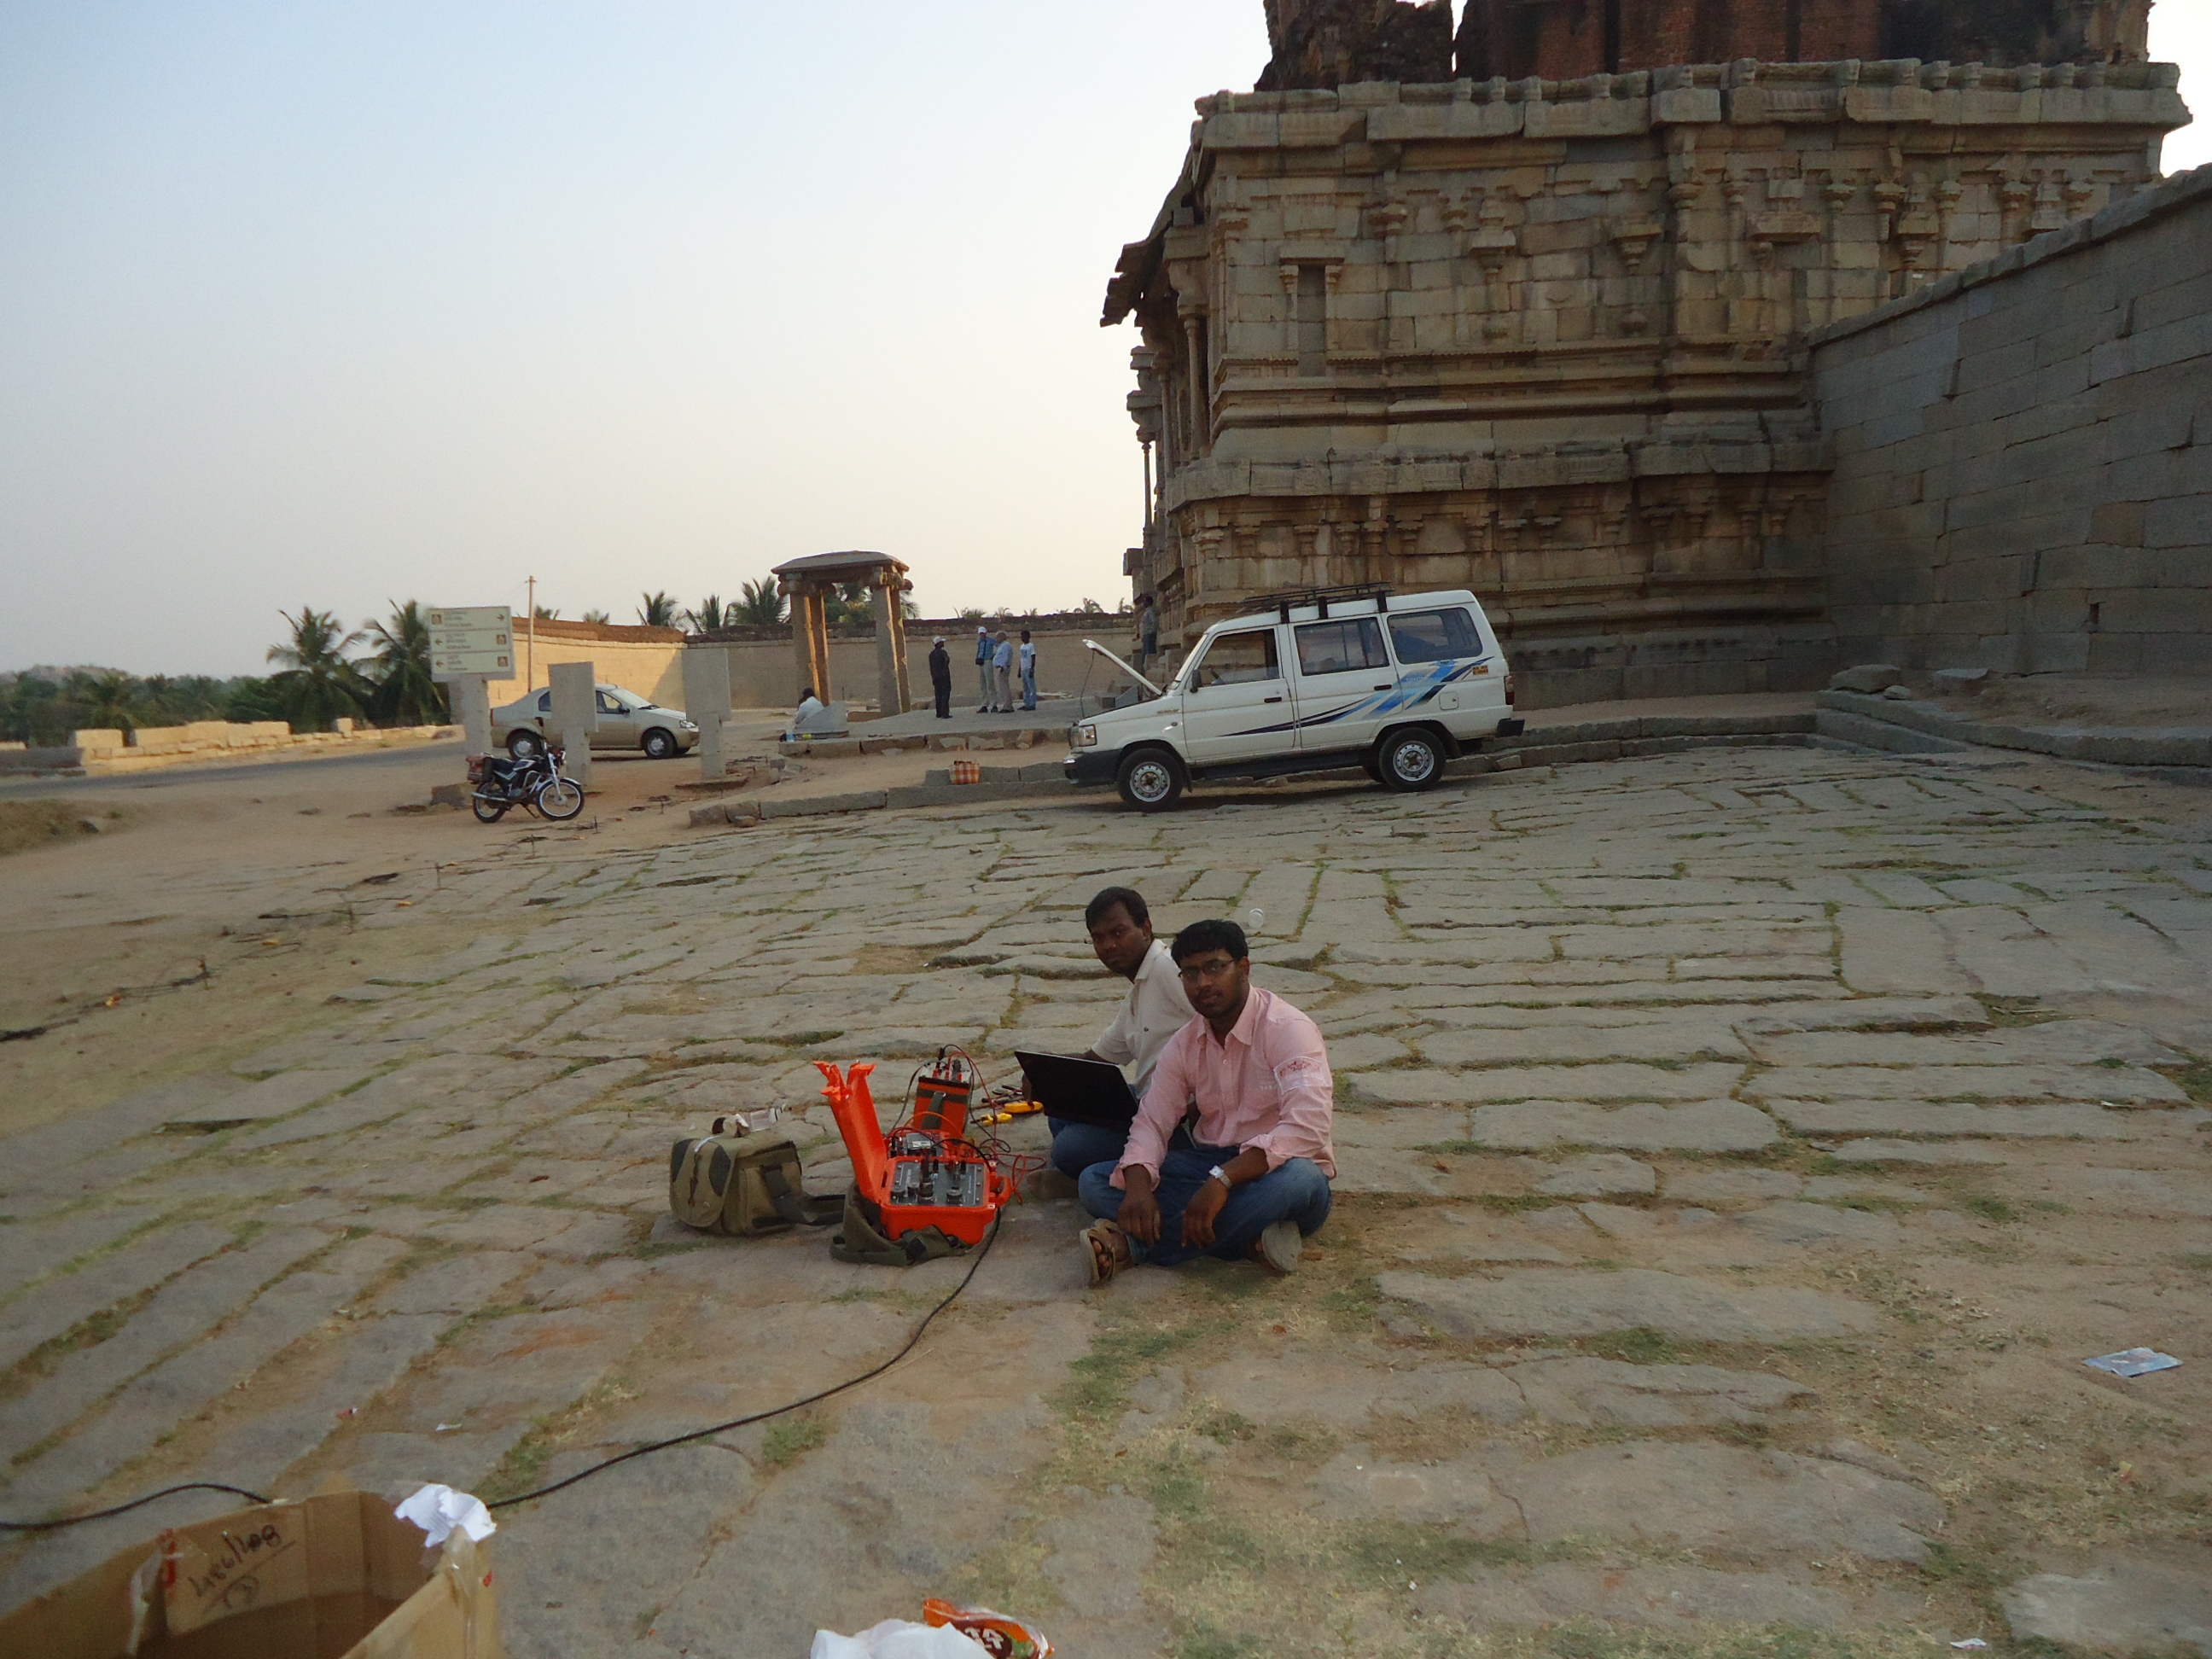
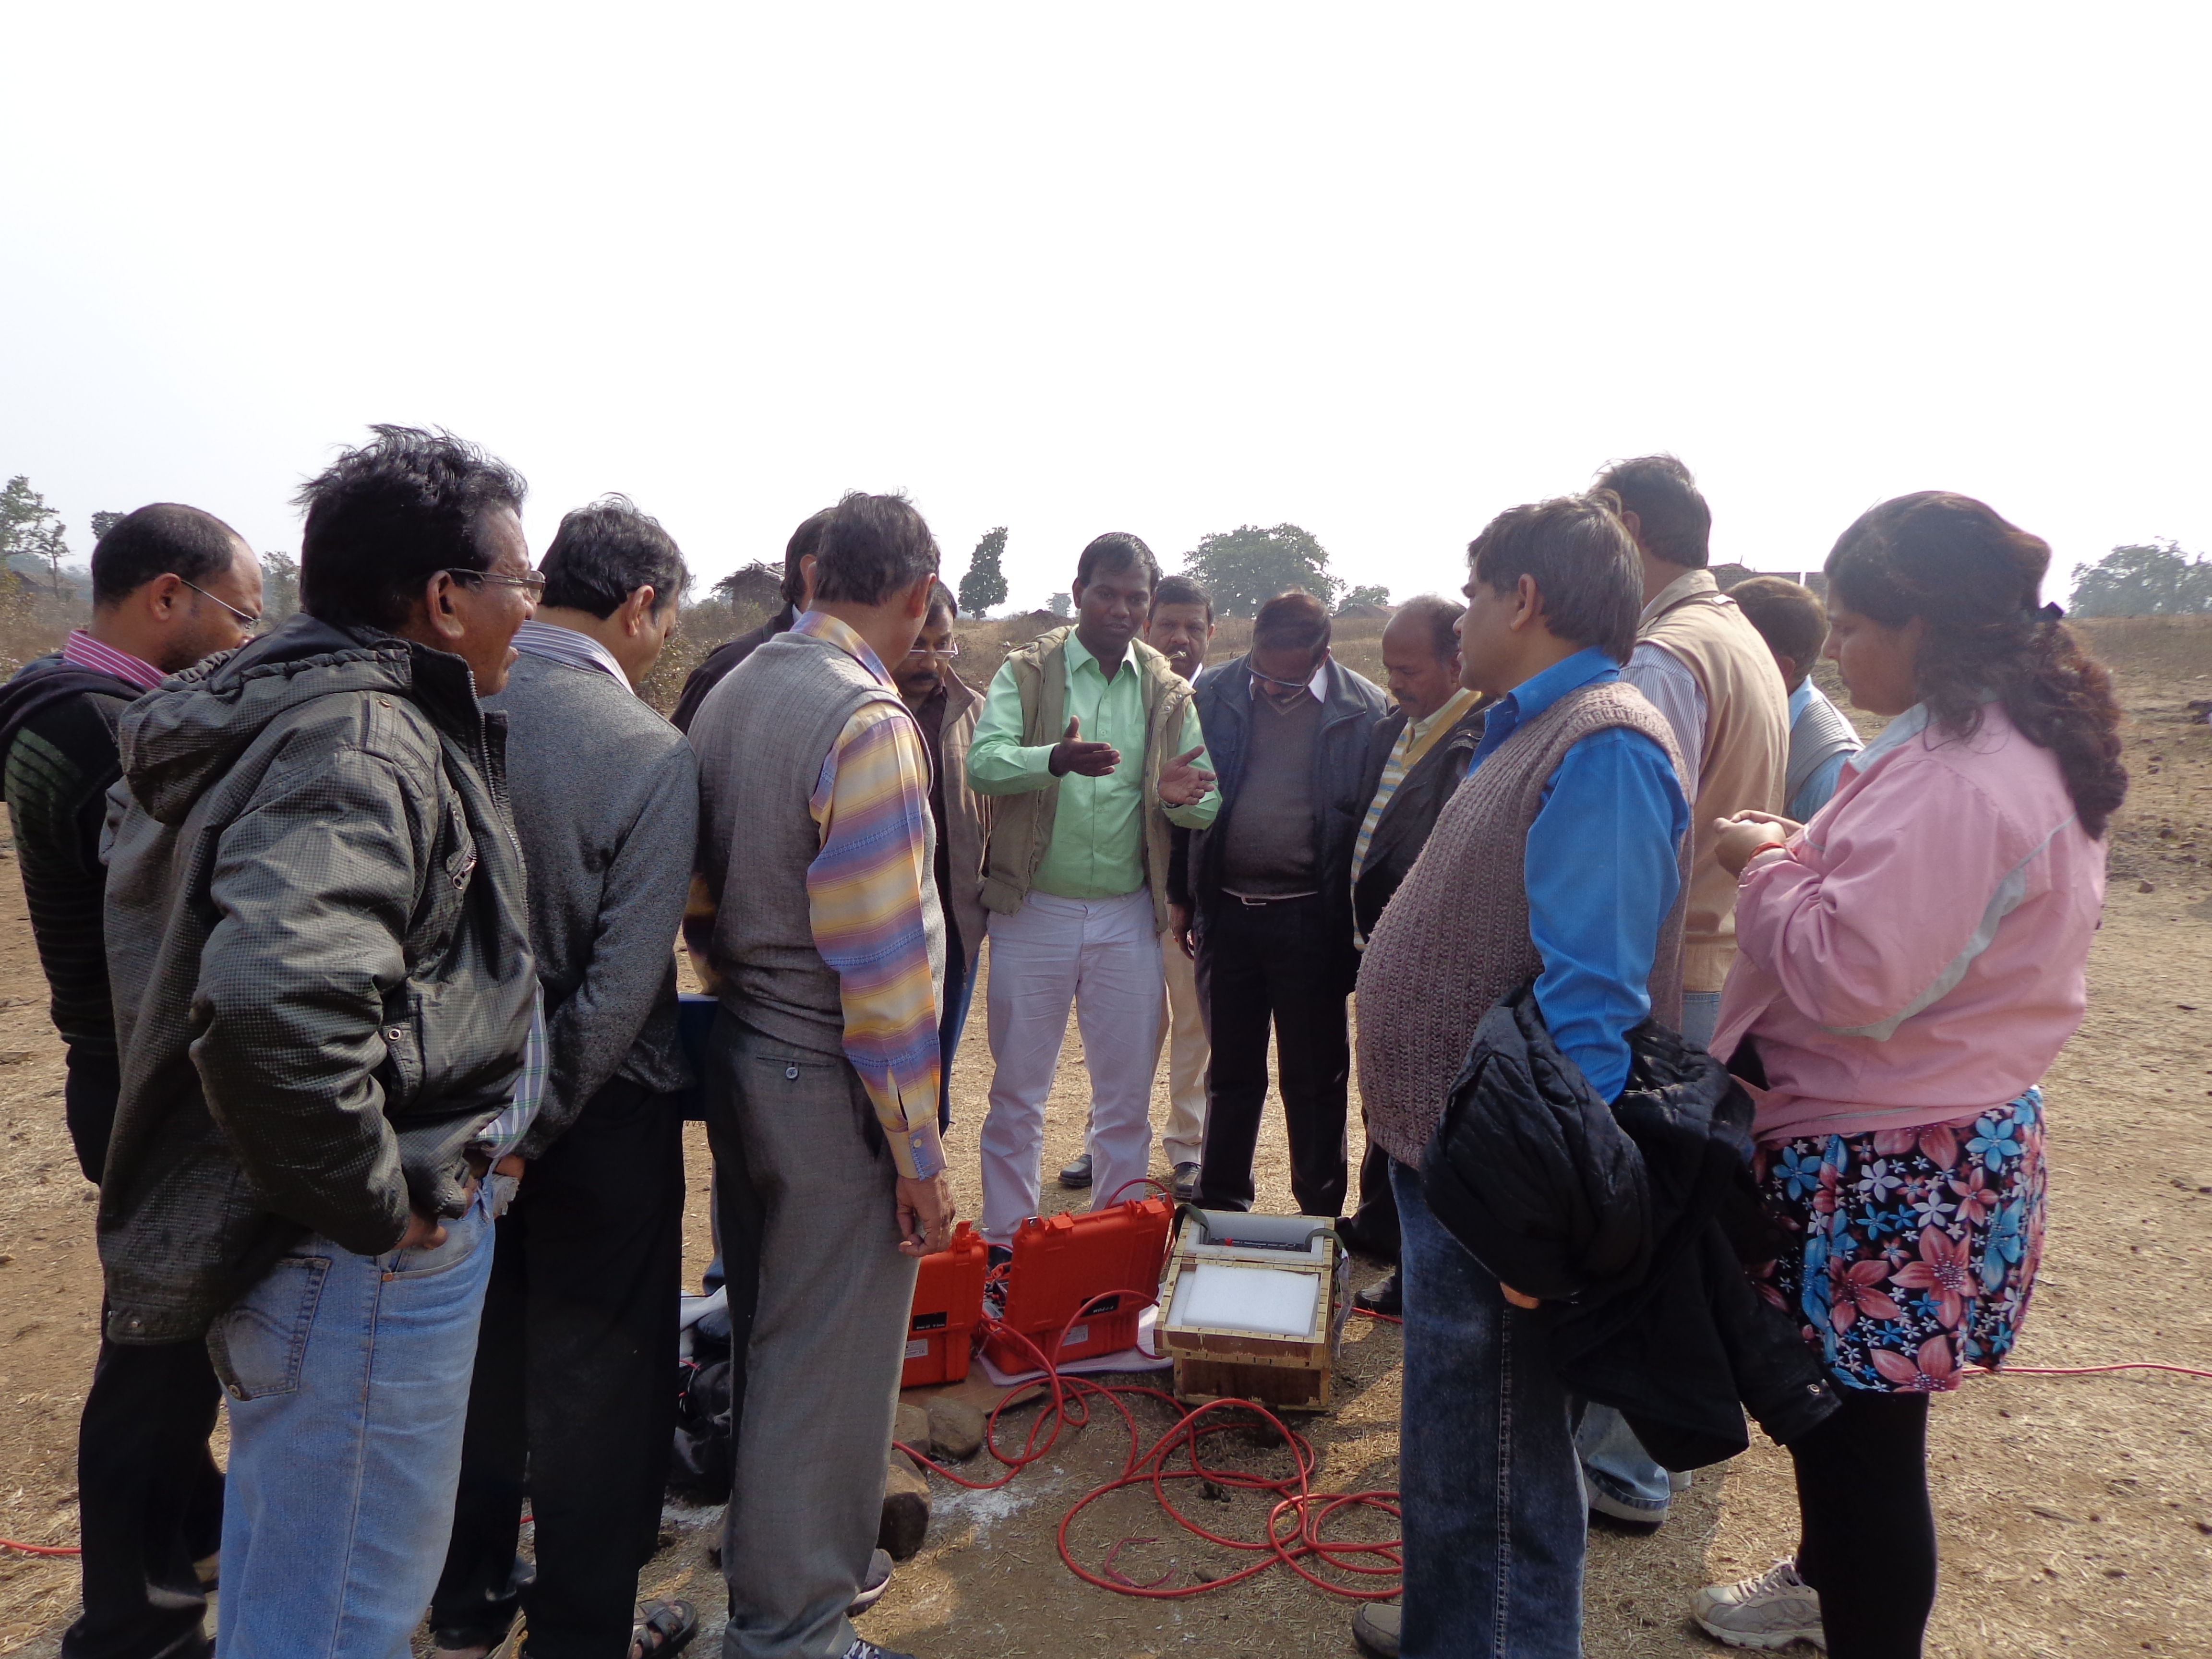
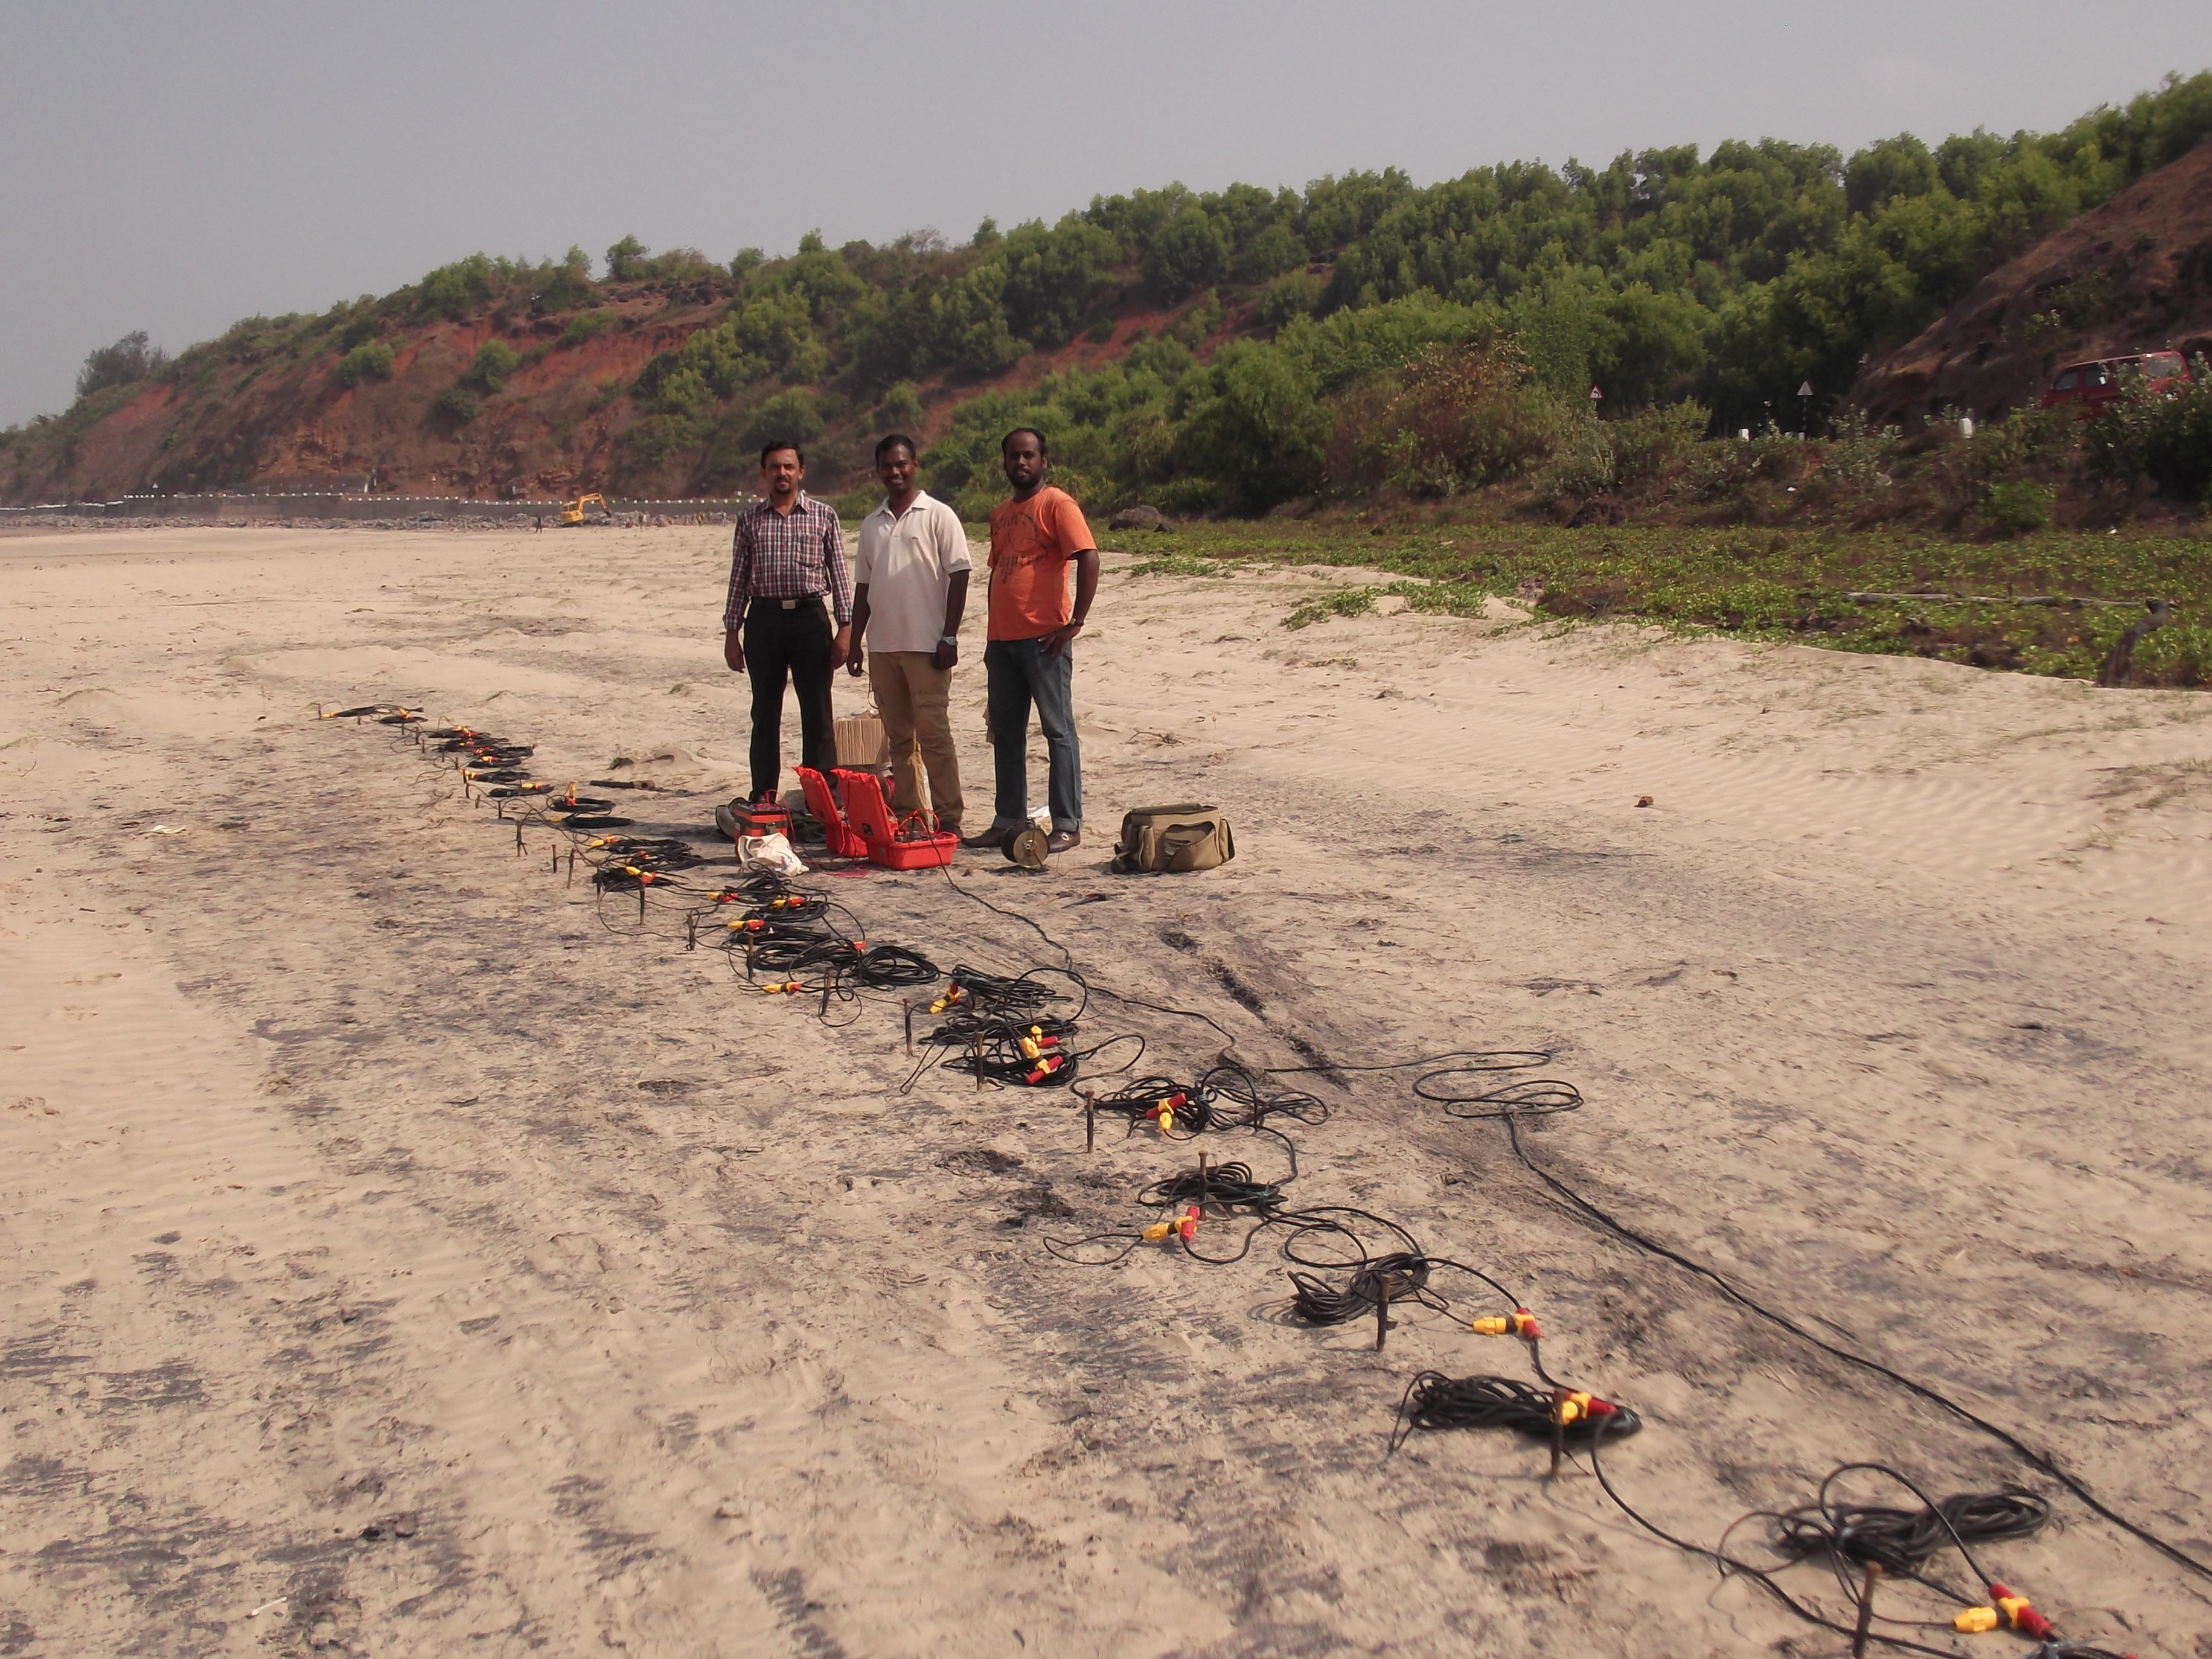
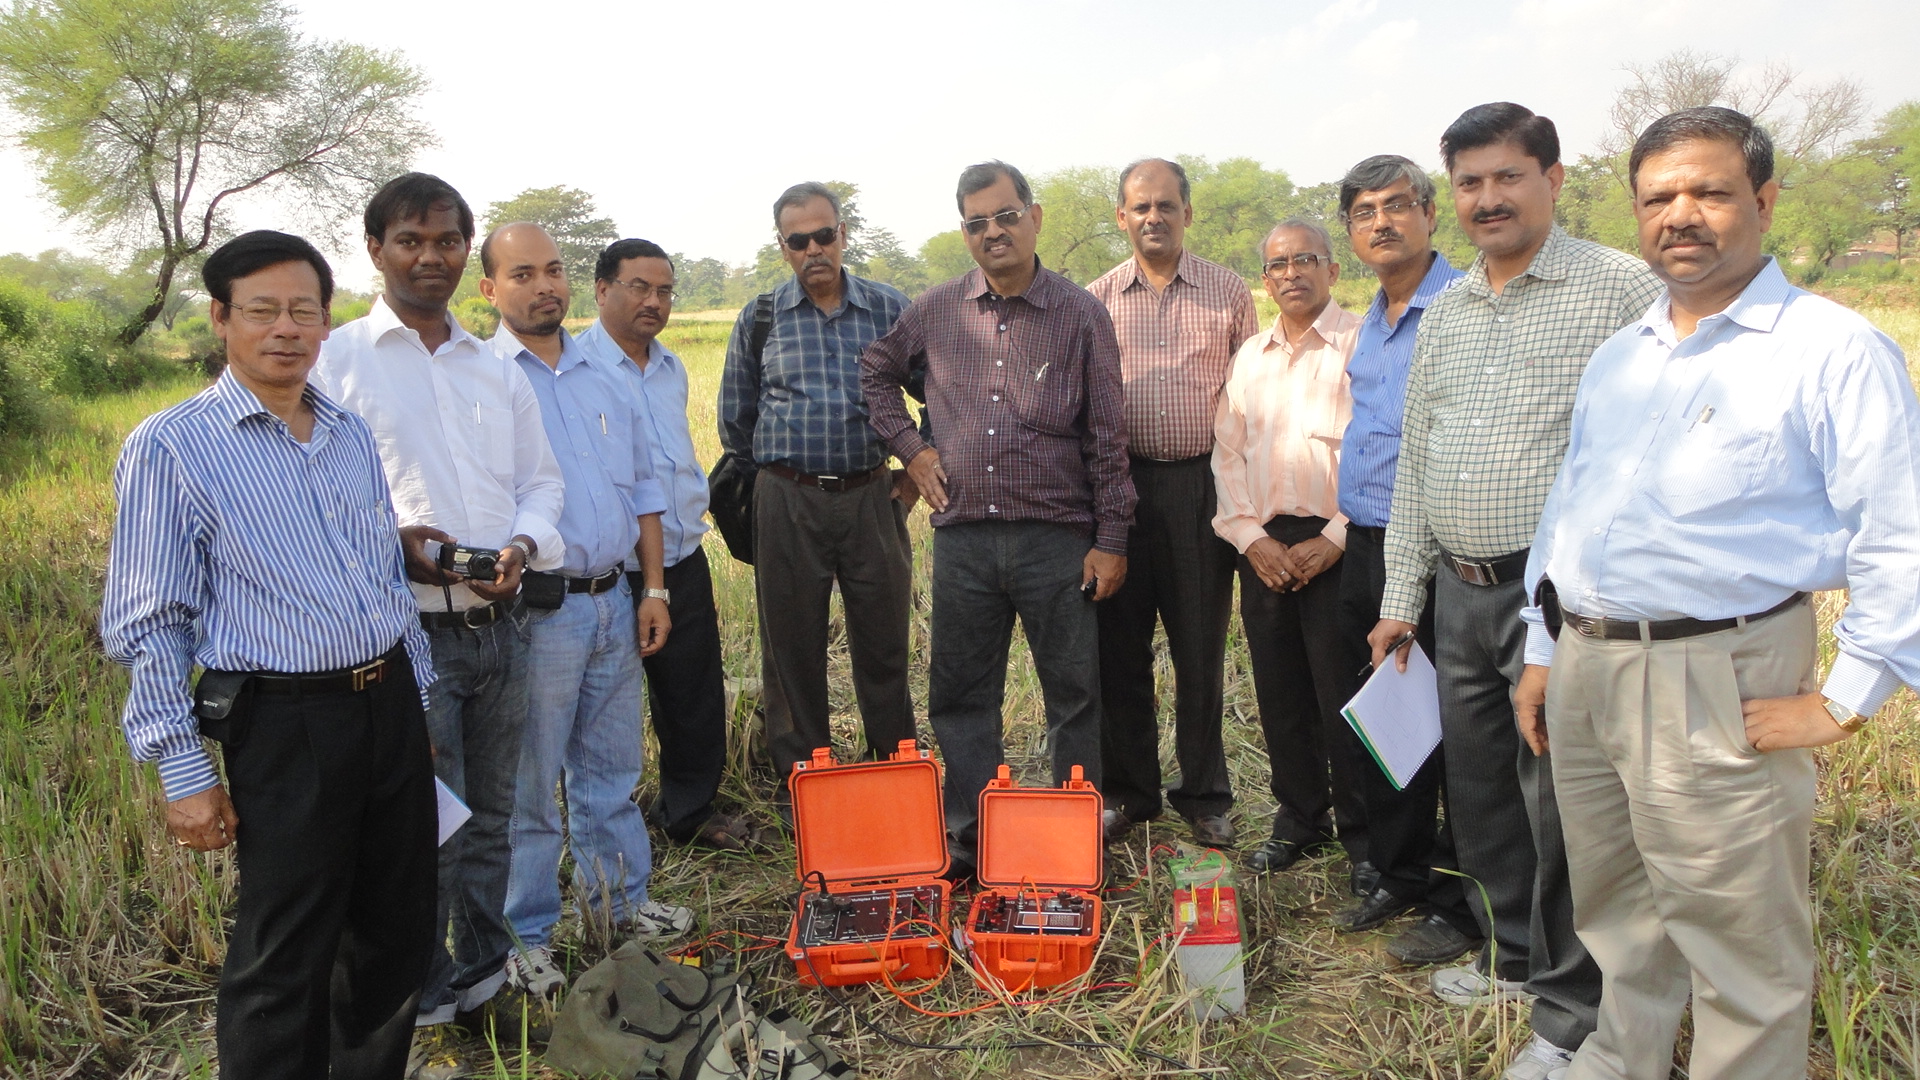
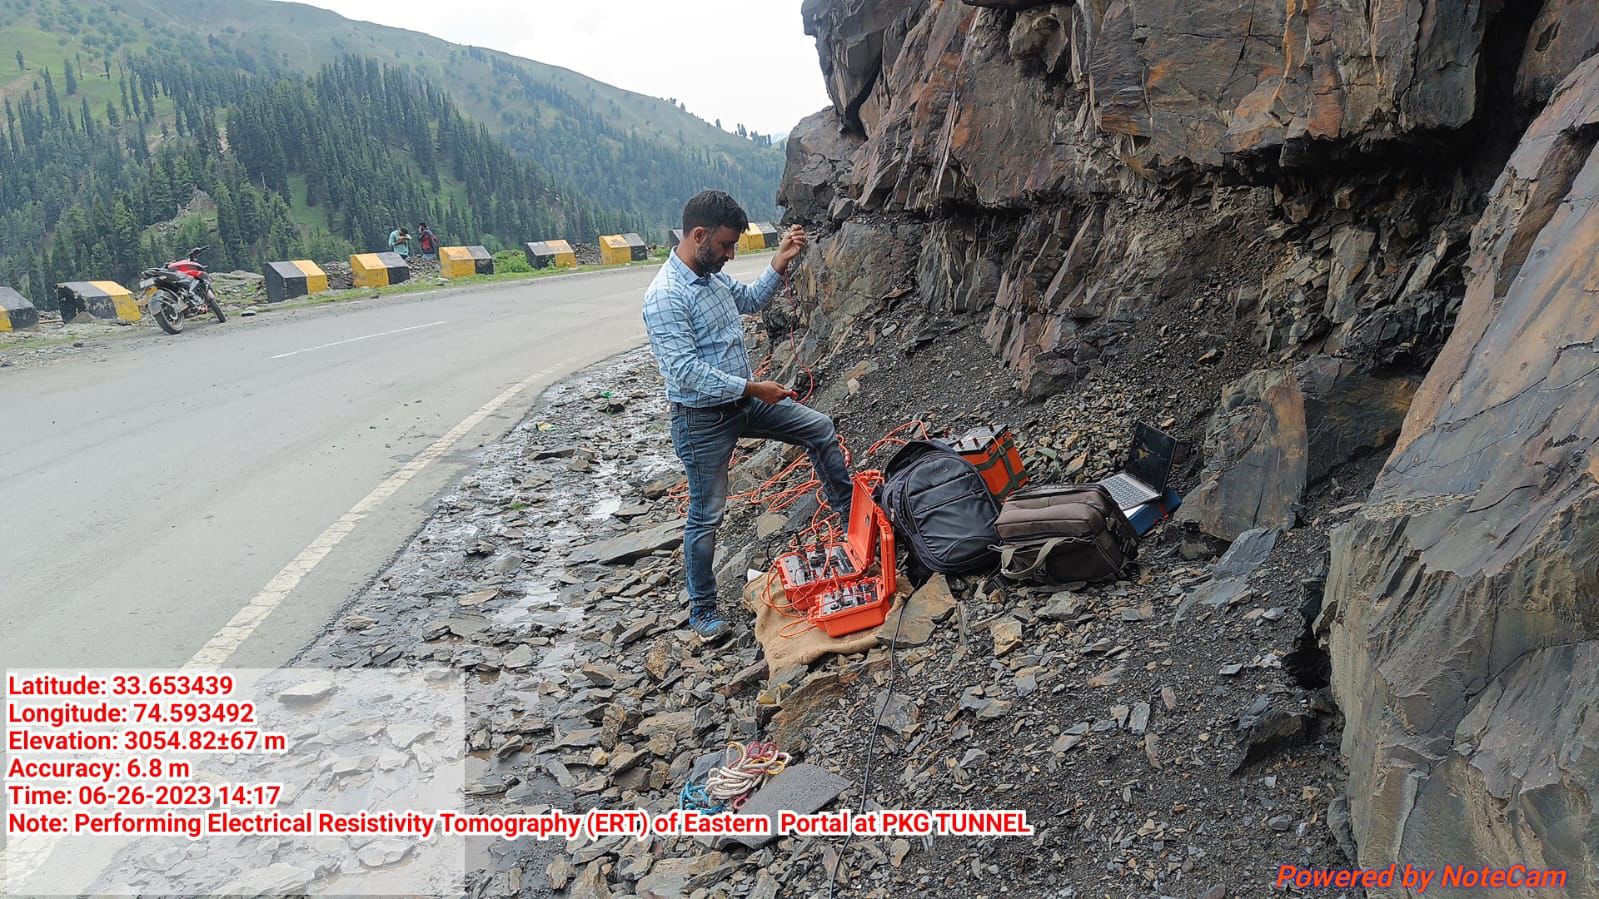
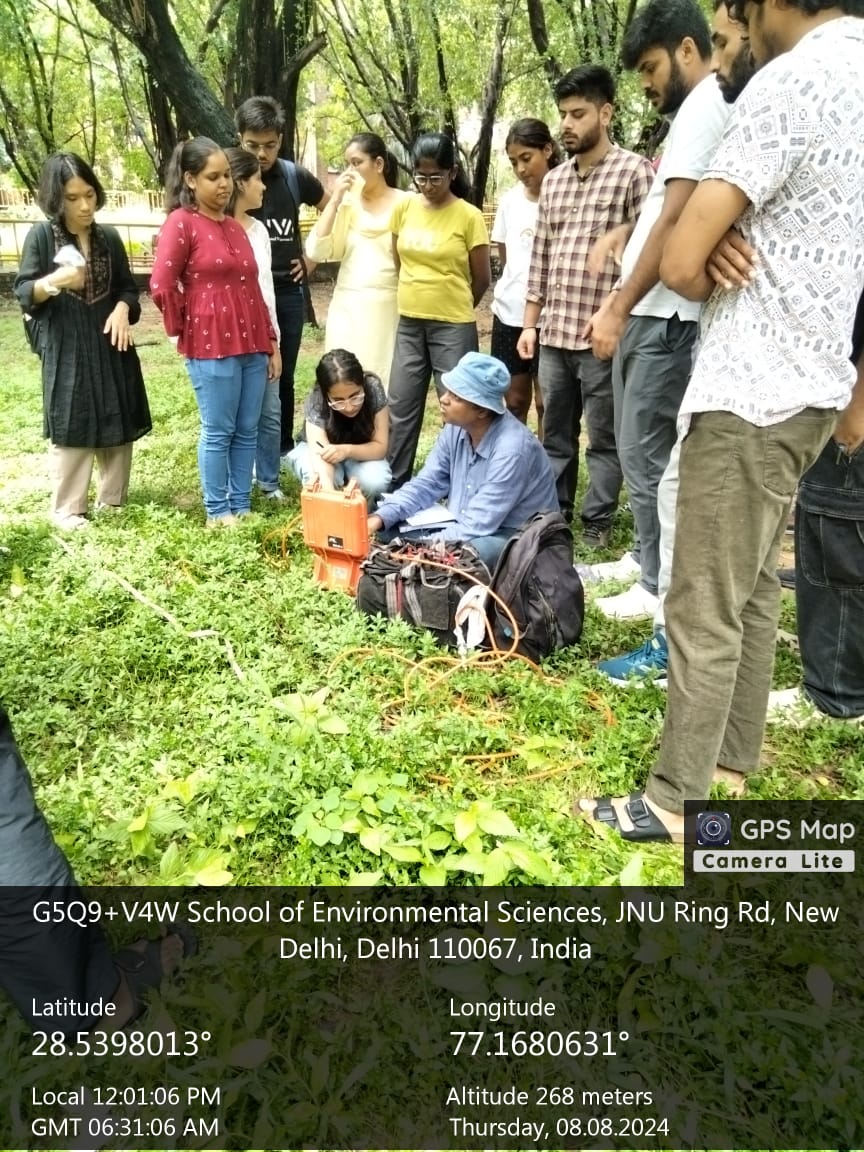
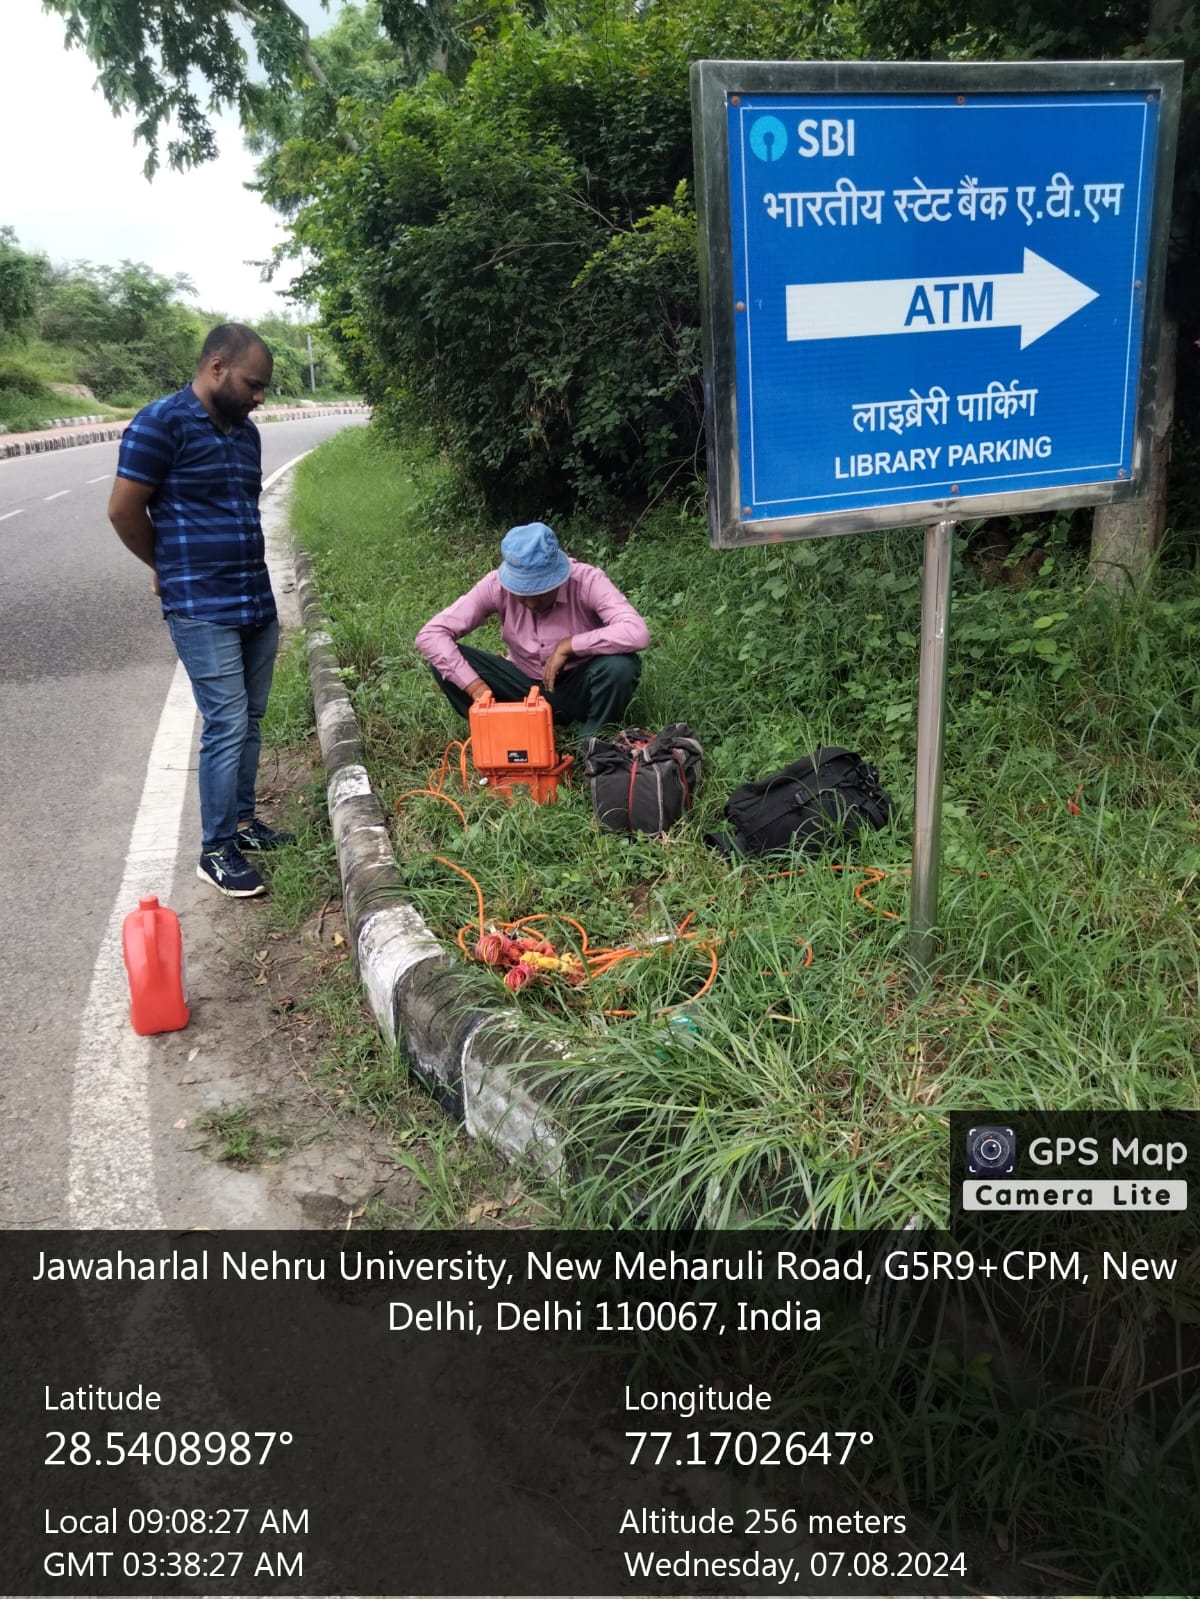
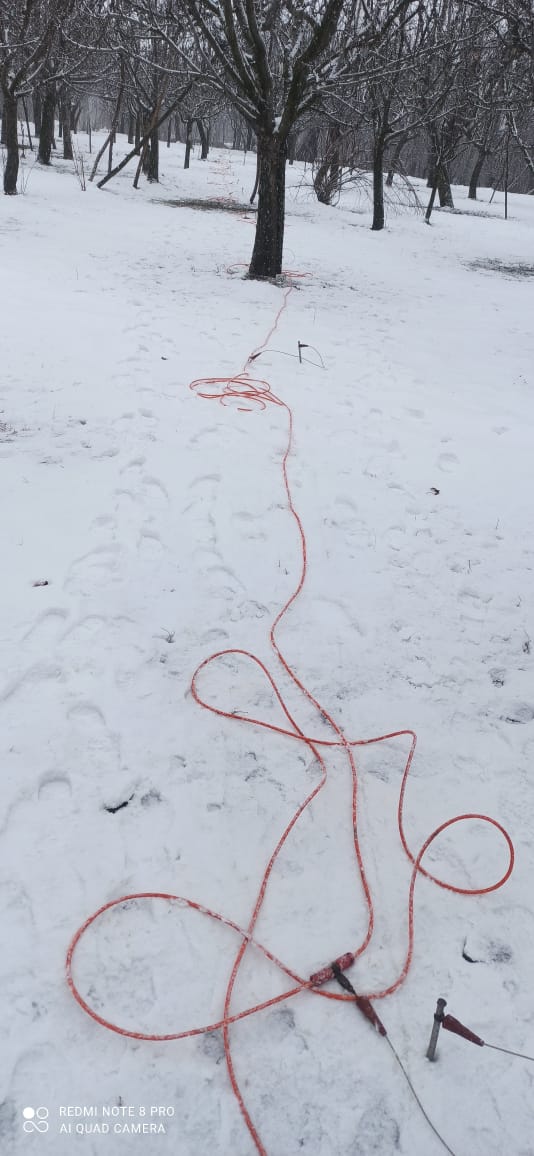
Field Images: