
If you don’t discover your Questions in FAQ.Please explore them from Us: wtsgeo@wtsgeophysical.com
Well logging, also known as borehole logging, is the practice of making a detailed record (a well log) of the geologic formations penetrated by a borehole. The log may be based either on visual inspection of samples brought to the surface (geological logs) or on physical measurements made by instruments lowered into the hole (geophysical logs). Well logging can be done during any phase of a well’s history; drilling, completing, producing and abandoning. Well logging is performed in boreholes drilled for the oil and gas, groundwater, mineral and geothermal exploration, as well as part of environmental and geotechnical studies.
• Resistivity& Spontaneous potential
• Natural gamma
• Caliper
• deviation
• Temperature
Resistivity logging is a method of well logging that works by characterizing the rock or sediment in a borehole by measuring its electrical resistivity. Resistivity is a fundamental material property which represents how strongly a material opposes the flow of electric current. In these logs, resistivity is measured using 4 electrical probes to eliminate the resistance of the contact leads. The log must run in holes containing electrically conductive mud or water.
The spontaneous potential log (SP) record the electrical potential from points within the borehole to an electrical ground at land surface. This potential is from the electrochemical differences borehole and formation fluids and is measured as a small DC voltage (mV) between the surface electrode and probe. SP logs can be used in the determination of lithology and water quality. SP logs are limited to water- or mud-filled open holes.
GR (gamma ray) logs record the amount of natural gamma radiation emitted by the rocks surrounding the borehole. Clay- and shale-bearing rocks commonly emit relatively high gamma radiation.
Caliper Logs record borehole diameter. Changes in borehole diameter are related to well construction to fracturing or caving along the borehole wall.
Temperature logs record the water temperature in the borehole. Temperature logs are useful for delineating water-bearing zones and identifying vertical flow in the borehole between zones of differing hydraulic head penetrated by wells. Borehole flow between zones is indicated by temperature gradients that are less than the regional geothermal gradient, which is about 1-degree Fahrenheit per 100 feet of depth.
Temperature logs record the water temperature in the borehole. Temperature logs are useful for delineating water-bearing zones and identifying vertical flow in the borehole between zones of differing hydraulic head penetrated by wells. Borehole flow between zones is indicated by temperature gradients that are less than the regional geothermal gradient, which is about 1-degree Fahrenheit per 100 feet of depth.
Length of the probe is 2.4m and diameter is 50mm
10. What is PVC cased, water filled, mud filled and air-filled holes suitable for gamma ray logging?
Gamma Ray Logging can be conducted in water-filled, mud-filled holes, or air-filled holes. The holes can be open or cased with PVC.
Caliperprobe length is 1.41m
Maximum depth is 3000m
8 hours.
Yes
The automatic winch can synchronise with mainframe for borehole logging survey.
Winch especially for long cable for maximum depth of 3000m has to be vehicle mounted. It needs 220V AC power for operation. If no electricity in field, you need the generator for winch operation.
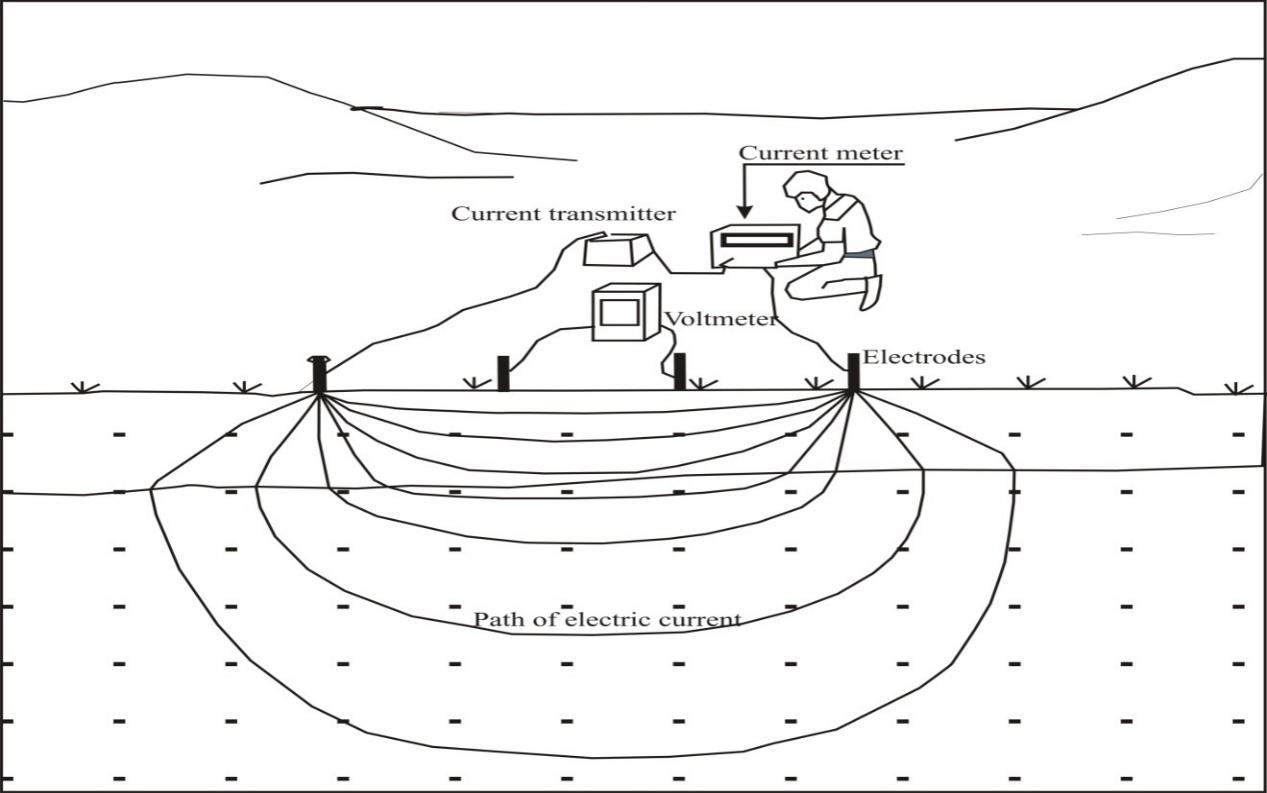
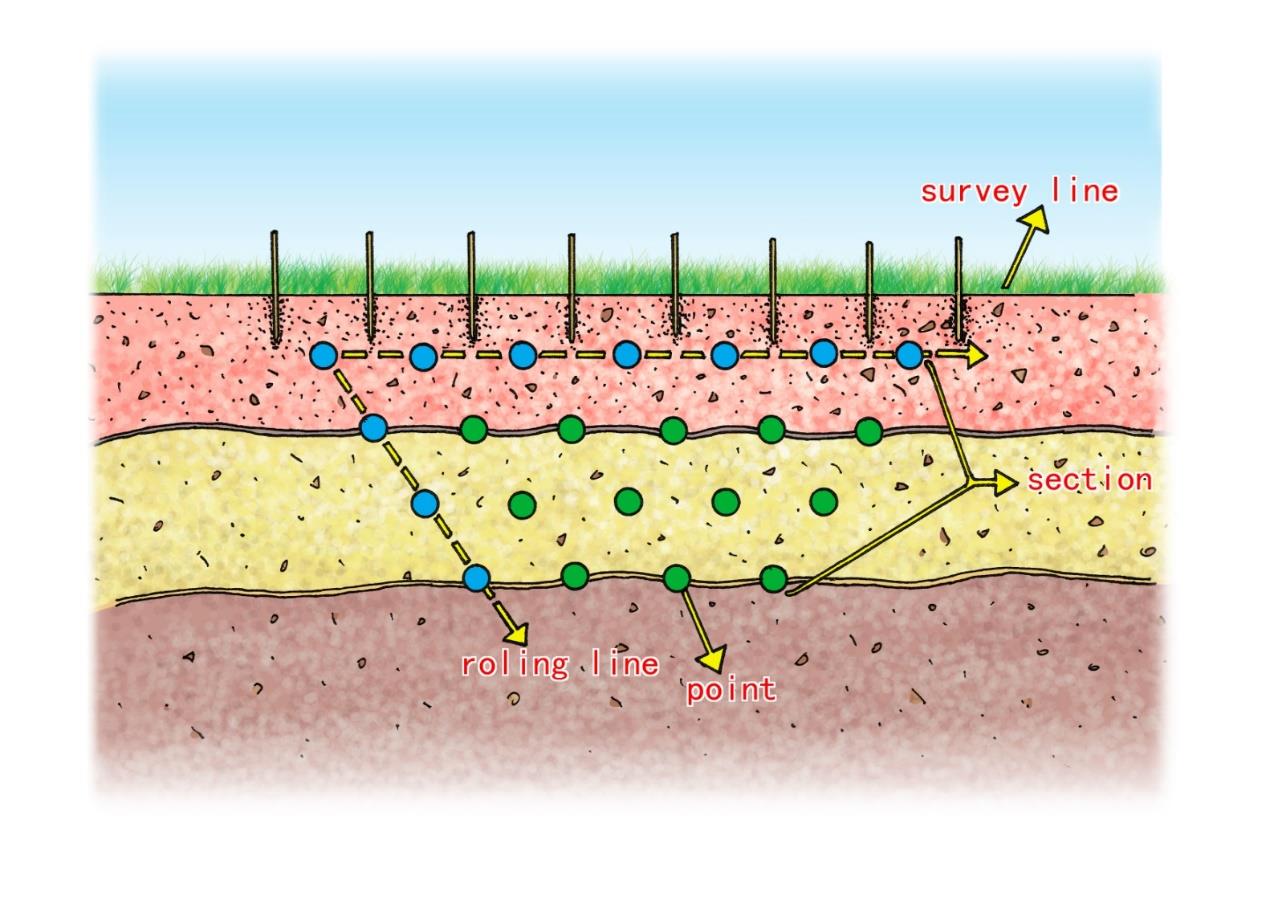
The resistivity survey is carried out by injecting DC current into the ground through two current electrodes and measuring the resulting voltage differences at two potential electrodes. For the current value (I) and the observed voltage difference value (V), an apparent resistivity value (ρa) is calculated as follows.
(ρa) ═ k V/I
Where, k is the geometrical factor which depends on the arrangement of the four electrodes.
The calculated value (ρa) is not the true resistivity of the sub-surface materials. An “apparent resistivity” value of a homogeneous ground will give the same resistance value for the same electrode arrangement. The relationship between the apparent resistivity and the “true” resistivity is a complex relationship. In fact, an inversion of the measured apparent resistivity values using a computer program is necessary to determine the true sub-surface resistivity. These resistivity values are used as the basic information to interpret the geology of the area. Proper equipment and internationally adopted methods will be used to perform the work. Depth of investigation depends upon the length of survey line and may vary on different resistivity profiles depending on the geological condition.
DC Resistivity is
commonly used to…
⦁ Delineate aggregate deposits for quarries.
⦁ Measure earth impedance for electrical grounding circuit.
⦁ Estimate depth to rock.
⦁ Estimate depth to water table.
⦁ Detect and map geologic features.
⦁ Define mining targets as part of an induced polarization survey.
In this method, current is injected into the ground by using two current electrodes (A and B) which are made of steel and are driven into the ground. The current is produced with the help of DC battery and equipment with complicated integrated circuitry (resistivity equipment). The travelling current sets its path and amplitude into the ground, which depends upon the nature of underground. The underground lithology (type of earth material) play major role in this regard. The response is recorded in the equipment with the help of two measuring electrodes (M and N), which are also driven into the ground. The procedure is repeated to a number of times by taking the electrodes farther away successively in every steep and the response reading is recorded in the equipment. Farther the electrodes from the center point, the response is coming from the deeper part.
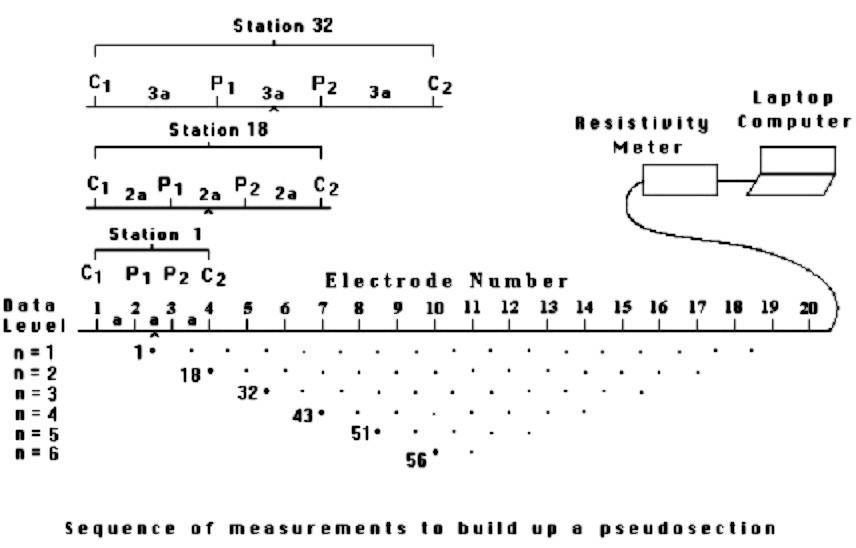
The greatest limitation of the resistivity sounding method is that it does not take into account lateral changes in the layer resistivity. Such changes are probably the rule rather than the exception. The failure to include the effect of such lateral changes can results in errors in the interpreted layer resistivity or thickness. Another classical survey technique is the profiling method. In this case, the spacing between the electrodes remains fixed, but the entire array is moved along a straight line. This gives some information about lateral changes in the subsurface resistivity, but it cannot detect vertical changes in the resistivity. Interpretation of data from profiling surveys is mainly qualitative. The most severe limitation of the resistivity sounding method is that horizontal (or lateral) changes in the subsurface resistivity are commonly found. A more accurate model of the subsurface is a two-dimensional (2-D) model where the resistivity changes in the vertical direction, as well as in the horizontal direction along the survey line. It is assumed that resistivity does not change in the direction that is perpendicular to the survey line. In many situations, particularly for surveys over elongated geological bodies, this is a reasonable assumption. Many different multi-electrode systems have been developed over the past 25 years using different arrangements of the cables and measurement strategies (Loke 2018). The survey is usually carried out with a system where the electrodes are arranged along a line with a constant spacing between adjacent electrodes. However, the program can also handle data sets with a non-uniform electrode spacing.
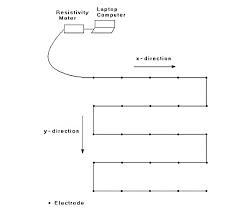
All geological structures are 3-D in nature, a fully 3-D resistivity survey using a 3-D interpretation model should in theory give the most accurate results. At the present time 3-D surveys is a subject of active research. However, it has not reached the level where, like 2-D surveys, it is routinely used. The main reason is that the survey cost is comparatively higher for a 3-D survey of an area that is sufficiently large. There are two current developments that should make 3-D surveys a more cost-effective option in the near future. One is the development of multi-channel resistivity meters that enables more than one reading to be taken at a single time. This is important to reduce the survey time. The second development is faster microcomputers to enable the inversion of very large data sets (with more than 10,000 data points and survey grids with more than 1000 electrode positions) to be completed within a reasonable time.
Induced Polarization (IP) is a geophysical method used extensively in mineral exploration and mine operations. The IP survey is very similar to electrical resistivity tomography (ERT). Resistivity and IP methods are often applied on the ground surface using multiple four-electrode sites. In an IP survey, in addition to resistivity measurement, capacitive properties of the subsurface materials are determined as well. As a result, IP surveys provide additional information about the spatial variation in lithology and grain-surface chemistry.
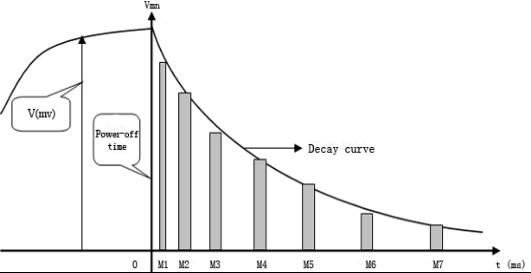
IP survey can be made in time-domain and frequency-domain mode. In time domain Induced polarization method, voltage decay is observed as a function of time after the injected current is switched off. In frequency-domain Induced polarization mode, an alternating current is injected into the ground with variable frequencies. Voltage phase-shifts are measured to evaluate impedance spectrum at different injection frequencies, which is commonly referred to as spectral IP.
IP method is one of the most widely used techniques in mineral exploration and mining industry and it has other applications in hydrogeology, environmental investigations and geotechnical engineering projects.
Natural Earth currents (telluric currents) and spontaneous potentials, which are essentially unidirectional or slowly time-varying, induce potentials in addition to those caused by the applied current. Spontaneous potentials in the earth may be generated by galvanic phenomena around electrochemically active materials, such as pipes, conduits, buried scrap materials, cinders, and ore deposits. They may also occur as streaming potentials generated by groundwater movement. (Electric fields associated with groundwater movement will have the greatest amplitude where groundwater flow rates are high, such as through subsurface open-channel flow. Groundwater movement in karst areas can exhibit rapid flow through dissolved channels within the rock. Springs and subsurface flow may be the cause of telluric sources, which may obscure resistivity measurements.). Telluric currents and spontaneous potential effects can be compensated by applying a bias potential to balance the potential electrodes before energizing the current electrodes. Because telluric currents generally vary with time, frequent adjustments to the bias potential may be necessary in the course of making an observation. If the instrument lacks a provision for applying a bias potential, a less satisfactory alternative is to use a polarity-reversing switch to make readings with alternately reversed current directions in the current electrodes. The average values of V and I for the forward and reverse current directions are then used to compute the apparent resistivity.
Voltage(V) in mv, Current(I) in mA, Resistivity(ΩM) in Ohm m and Self-potential (SP) in mv

| Model Support | W-2 Series | W-3 Series | WERI Series | |
|---|---|---|---|---|
| Function | 1D Res survey | • | • | • |
| 1D IP survey | x | • | • | |
| 2D Res Imaging | x | • | • | |
| 2D IP Imaging | x | • | • | |
| 3D Res Imaging | x | x | • | |
| Transmitter | Max Output Current | 3.5A | 6.0A | 6.0A |
| Max Output Voltage | 1000V | 1000V | 1200V | |
⦁ Self-Potential Measurement
⦁ Self-Potential Nullification or Cancellation
⦁ Ground Contact test or Rg test
⦁ Input Impedance
⦁ Noise Rejection or Suppression factor
Both these models have inbuilt rechargeable power source of 12v Li ion Battery for display or screen operation only. W-2 Series, and WERI Series has inbuilt power source for both display operation and display operation.
Using adapter cable, mainframe could draw power from 12v car battery and continue the survey.
WERI Series mainframe could perform Roll along function
| S.No. | Parameter | Centralized Cable System | Distributed cable System |
|---|---|---|---|
| 1 | Configuration | W-3 Series or WERI Series (Res/IP meter) + WES 60 (switcher) + 30 take out Res Imaging Cable (Minimum 2 pcs). Refer: WERI Series + WES 60 configuration in product page | W-3 Series or WERI Series (Res/IP meter) + single or Dual take out Imaging Cable (Minimum 4 pcs). Refer WERI Series configuration in product page |
| 2 | Function | Provision for Resistivity Imaging only. | Provision for resistivity & induced polarization imaging only. |
| 3 | Arrays | 18 Arrays only. | 18 Arrays + 1 additional Custom Array is possible. |
| 4 | No. of. Electrodes | Maximum electrode capacity: 60 or 120 (with Switcher Box). | Maximum electrode capacity: 250 electrodes (without Switcher Box). |
| 5 | Profiling | Profiling is limited with 60 electrodes only. If required for long profile additional switcher box (WES 60) is required for developing profile for another 60 electrodes. | Profiling development is unlimited, even more than 250 electrodes were used (if enough Power supply is used). There is no need of SWITCHER for profiling development. Cable head is simple, and it can connect in series as 'relay unit' to develop long profile. |
| 6 | No of take outs | 30 take out at 10m spacing (Single Mode Only). | 10 take out (Single or Dual mode). |
| 7 | Portability | Heavy & portability in typical terrain is cumbersome. | Light Weight and Portable is feasible in all kinds of terrains. |
| 8 | Layout | Single Layout Only (Equipment is placed at center position during the survey). | Triple layout i) Equipment at center position. ii) Equipment at right side of Survey line. iii) Equipment at left side of Survey line. |
| 9 | Durability | Major Disadvantage: Either cable or SWITCHER BOX may be vulnerable to damages on inappropriate handling. It is very expensive to replace either Imaging cable or Switcher Box. | Major Advantage: Cable is rugged, strong, even worst case, cable got damaged, replacement cost is very less. |
| 10 | Target Mapping | Datum points may be insufficient to map the critical target (with smaller dimensions). | Datum points are sufficient to map the critical target (with smaller dimensions or more sensitive) more precisely & accurately. |
| 11 | Data Acquisition | Data Acquisition take long time and more noise in the deeper layers. | Data Acquisition is faster, and auto-stacking avoids the noise & thereby increase the data quality and resolution of the target mapping respectively. |
1X1D, Surfer and IPI2win
Res2DInv , Res3DInv, Zond Res2D Software and GeoGiga
Standard electrode spacing 5m and 10m. We could customize and supply based on survey requirement (For instance). We could supply at 2m spacing, 20m spacing.
Data from equipment transferred to PC or Tablet via RS-232 port. It is available in Dat Format.
⦁ Down load data files (*.wda) to your computer, either laptop or desktop;
⦁ Run WDAFC.exe (which will be provided in the CD delivered with instrument),
⦁ Click "open WDA data file to convert" button and in the prompted dialog browse to the *.wda you saved from equipment.
⦁ In the same folder, a "Converted data" folder will be generated where *.dat file with same
⦁ File name will be located.
⦁ Start up surfer or inversion software and read the converted *.dat files.
Geophone is a small, economical tool for measuring ground motion. There are many different varieties for different applications. They are designed for earthquakes, machine vibrations, oil exploration, mining, etc.
⦁ Oil Exploration
⦁ Mineral Exploration
⦁ Earthquake Monitoring
Most of the models have a coil hanging from a spring in the center of some magnets. When the case is moved up and down the mass tends to stay put and induces small currents into the coil as it moves through the magnetic field. It measures velocity of motion.
Not really. Geophones would stay in between accelerometers and seismometers in function and price. Seismometers are typically larger and more expensive. They usually detect extremely small movements at lower frequencies than geophones. Seismometers can be very fragile and sensitive, although they are designed to survive earthquakes, that may be from hundreds of miles away. Calibrating a seismometer might be critical to getting useful data out of it and a geophone or accelerometer would be more likely to be used just to get a simpler signal.
Accelerometers are nearly solid state and good at handling more violent motion. Video games and cell phones are now using accelerometers to interact with the users as another input device.
All three might have an intended axis or orientation (XYZ or Mercator plus vertical) or they might be a bundle of more than one axis in the same package. Single axis instruments are limited in function off intended axis.
⦁ Natural Frequency
⦁ Coil Resistance
⦁ Moving Mass
⦁ Harmonic Distortion
⦁ Open Circuit Damping
⦁ Damping with Shunt Resistor
⦁ Sensitivity with Shunt Resistor
⦁ Open Circuit Intrinsic Voltage Sensitivity
⦁ Damping Calibration-shunt Resistance
⦁ Typical Case to Coil Motion p-p
⦁ Typical Spurious Frequency
Geophone is an instrument used to transform seismic energy into an electrical voltage. It ordinarily responds to only on component of the ground’s displacement, velocity, or acceleration associated with the passage of a seismic wave. For a seismic reflection survey with P-waves, this is the vertical component. A motion-sensitive transducer converts ground motion to an electrical signal. The transducer in nearly all modern geophones is a moving coil electrodynamic type and consists of a coil suspended by one or more springs in a magnetic field that is fixed relative to the geophone case. A seismic wave moves the case and the magnet, but the coil remains relatively stationary because of its inertia. The relative movement of a magnetic field with respect to the coil generates a voltage across the coil that is transmitted by wire to the seismograph.
Depending on the frequency characteristics of the geophone, the voltage is proportional to the relative velocity of the coil with respect to the magnet (when movement is above the natural frequency of the geophone) or proportional to frequency and hence to the acceleration involved in the seismic passage (when the movement is below the natural frequency). The first case, the so-called velocity geophone, is commonly used. For shallow seismic reflection surveys a natural resonant frequency is in the range of 30-50Hz which is recommended by Steeple et al (1997). Details on performance characteristics of geophone are given e.g. by Knapp& Steeples(1986a) or Pelton (2005). The quantity of the recorded seismic signals is finally dependent on how good the geophone is coupled to the ground. In the field, one must take care to use a good planting of the geophone by a metal spike to the ground and to make sure that it is oriented in the direction of particle movement of the seismic wave (for a P-wave this is the vertical direction). For a signal enhancement, geophones may be grouped, with several geophones feeding a single channel of the seismograph, and the signals are summed.
There are huge differences between the models and options for geophones. The exterior case is optional on a lot of geophones. Some have coaxial connectors, and some have binding post connectors, but most have two little pins that you connect your leads to. The resonant frequency is one of the main factors in the price. Lower resonant frequencies are more difficult to achieve in a small box with a light weight and a low price. Basically, you want the resonant frequency to be close to what you’re looking for in signals. Also, your application should be a factor. You probably don't need a 1 Hz resonant frequency to watch local earthquakes, but you would want one for distant earthquakes. The frequency response of an instrument is probably centred around the resonant frequency and is very narrow in width.
Horizontal wave geophone is sensitive to horizontal wave while vertical geophone is sensitive to vertical wave respectively. The horizontal wave geophone should be embedded horizontal and preferably in one direction to avoid the different sensitivity in different position, the work is not easy.

Magneto telluric (MT) is an electromagnetic geophysical method for inferring the earth's subsurface electrical conductivity from measurements of natural geomagnetic and geo-electric field variation. Magnetic fields in the frequency range of 1 Hz to approximately 20 kHz are part of the audio magneto telluric (AMT) range.
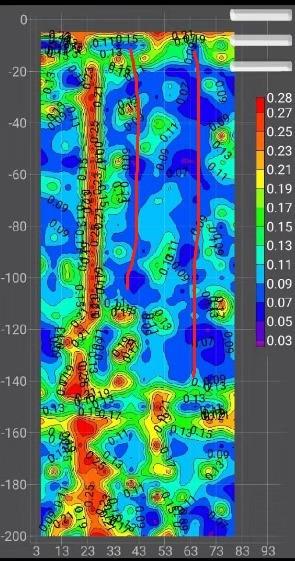
Depth of investigation depends on the transmitted frequency and resistivity of the subsurface. Lower the frequency, greater the depth of penetration. The prospecting technique is based on natural electrical field which is influenced by resistivity contrast of underground minerals and ground water. Without heavy power supply, it uses low frequency signals & natural electric field as signal source. Equipment is automatically controlled by micro PC with a high resolution of measuring accuracy of 0.001 mill volt. The output will be in the form of 2-D profile with anomalous zones .Currently this is one of the most updated and effective detecting method in the world. It can be widely used for detail and general survey of underground water detecting, geothermal and other energy prospecting work. It will improve the successful rate of drilling water well. Survey photo and Output is shown below which helps in identifying ground water accumulation locations.
⦁ Ground water prospecting
⦁ Hydrocarbon exploration
⦁ Mining exploration
⦁ Geothermal exploration
⦁ Other commercial applications
By the M, N electrode probe ( transducer ) via a cable earth's magnetic field to electrical signal input to high impedance input stage , after the anti-jamming exchange amplification, frequency selection, select the desired operating frequency, and then by the A / D sampling, central processor (CPU) for data processing. Where in the entire measurement process, high-speed central processing unit (CPU) of the control, instrumentation automatic range conversion and automatic frequency selection. Finally display the measured data and curves graph, and then click “profile “the instrument will automatically draw profile map directly on the LCD of instrument, also can Output measurement data, curve graph and profile map by USB cable to computer for analysis and making geological conclusion.
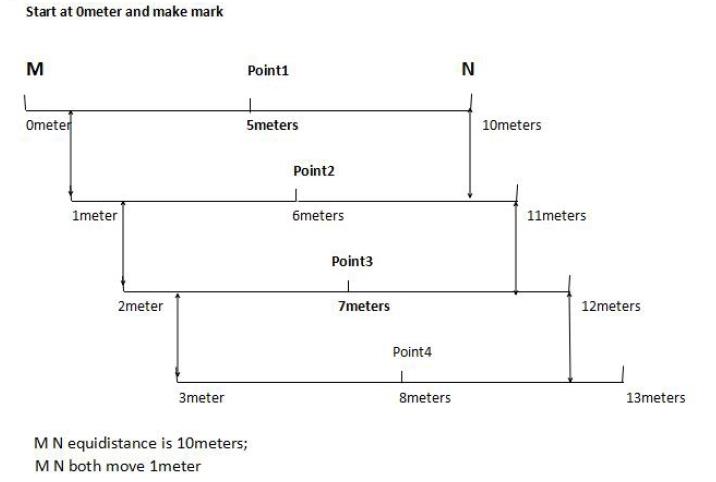
Tap 10 meters distance and mark the start place of 0 meter. The M N two electrode bar equidistance is 10meters, both M N will move 1meter after finished measure the point1 and MN Electrode equidistance wiring as below:
The unit of the measurement is “mv (the unit of electromagnetic signal)”
ADMT Series supports depth of Investigation from 0-800m .It is available in different depth variants such as 100m, 200m, 300m, 400m, 600m, 800m.
ADMT device will measure up to the maximum depth fixed in the configuration. But new wireless version supports controlling depth. Customer can measure desired depth within the limit of configuration.
Touch Screen and Mobile app version
Touch screen: Data input and Data Acquisition is done using Touch screen device itself
Mobile App: Data input, Data Acquisition and Data Processing is done using Mobile application software.
It can install in android mobile device only.
OTP is required first time for activation of app in your mobile.
Totally 6 Nos of Mobile can be paired to the device.
Bluetooth
No
Totally 6 measurement is sufficient to develop the 2-D and 3-D graphs
Totally 100 Nos of Soundings is the maximum limit.
Sensor is used to measure data in urban areas with cemented or concrete slabs or Asphalt roads.
X-axis represents the profiling distance of electrode or sensor on the ground surface.
Y-axis represents the depth of Investigation from ground level in metre
Magnetometer is an instrument used to measure the strength and direction of the magnetic field in the vicinity of the instrument. Earth’s magnetism varies from place to place due to heterogeneity nature of rocks or the interaction between charged particles from the sun and the magnetosphere. Magnetometers are used in geophysical surveys because they can measure the magnetic field variations caused by rocks and mineral deposits. The method has the advantage of being one of the easiest and cheapest geophysical techniques to carryout, since large areas can be covered quickly at a low cost and few corrections to the field data are required.
Magnetic surveying has been widely used for many years in mineral and oil exploration industries but with recent advances in the speed of operation and resolution of portable systems can be used for industrial and environmental application such as:
- The detection of abandoned mine shafts.
- Detection of man-made targets such as brick lined shafts or the remains of ancient dwellings.
- Location of underground storage tanks and buried steel drums.
- Mapping contaminated sediments.
- Archaeological site investigation.
Magnetometers are widely used for measuring the Earth's magnetic field and in geophysical surveys. to detect magnetic anomalies of various types. It also known as the proton precision magnetometer (PPM), uses the principle of Earth's field nuclear magnetic resonance (EFNMR) to measure very small variations in the Earth's magnetic field. allowing ferrous objects on land and at sea to be detected.
Basic difference of aforesaid models are listed below.
| Model | Battery | GPS | Weight |
|---|---|---|---|
| WZ-1 | External rechargeable | No | 2.5kg |
| WZ-1B | Internal rechargeable | No | 2.1kg |
| WZ-3 | Internal rechargeable | Internal GPS | 1.5kg |
There are three working modes of proton magnetometer which includes:
- Station mode
- Walking mode
- Horizontal/Vertical Gradient mode
- Estimated magnetic field and the actual magnetic field are quite different.
- Sensor is not well connected. Please check whether the sensor cable is short-circuited or broken.
- Sensor is open circuit. Check the impedance of the sensor; nominal impedance should be about 12ohm.
- Noise is too high in that thunder or power line exists.
A HD digital camera probe is used for the WTS-DCT(D) Borehole TV Tester to record a magnetically oriented, color optical image of the borehole. The optical image can be viewed and recorded in real time in a control computer. Well construction, lithology and fractures, water level, cascading water from above the water level, and changes in borehole water quality (chemical precipitates, suspended particles, and gas) can be viewed directly with the televiewer. It is also used to record and extend the image within the effective image range of the probe and save the images of the probe in video mode
The maximum test depth of WTS-DCT(D) Borehole TV Tester 300 meters.
The standard depth of WTS-DCT(D) Borehole TV Tester is 100 meter . Other depths can be customized according to customer needs, and the customized range is within 0-300 meters. Customized ordering may require an additional month’s lead time.
The company has not done automatic winch plan for the time being. We will do the relevant design according to the market demand.
The measuring steps of WTS-DCT(D) Borehole TV Tester are divided into 5 steps:
1. The tripod should be erected firmly, stably, and aligned with the center of the hole.
2. The probe is firmly connected with the connecting cable, and the probe is set up in the center of the hole.
3. Set up the depth counter and adjust the relevant parameters of the instrument.
4. Lower the probe, and the software program will automatically collect images and videos.
5. Save the data and analyze it.
The host has the following functions:
1. Power the probe.
2. Transmit video signal to laptop.
3. Control the circuit inside the probe.
The image format is PRJ and the video format is AVI.
Yes
Yes, When the customer uses it, after selecting the video function, WTS-DCT(D) Borehole TV Tester’s program will be automatically saved in the created folder.
The video file is in AVI format.
The diameter of probe is 60mm.
The length of probe is 410mm.
The probe can withstand a water pressure of 3MPa.
The host is connected to the laptop through WIFI signal or network cable.
The longest use time of WTS-DCT(D) Borehole TV Tester is 8 hours of continuous work.
It is a method of determining sub-surface information by analysing sound waves originating from an energy source.
The energy source is typically either a small amount of dynamite in a shot hole, drilled to depths of 5 to 150 feet or vibrations generated from a series of "vibrioses" trucks.
The reflected sound waves are detected by listening devices called geophones that are laid out along the seismic line. They are usually attached to cables, that connect into a recording truck / doghouse where the seismic data is recorded onto computers.
When an earthquake occurs, it releases energy in the form of seismic waves that radiate from the earthquake source in all directions. The different types of energy waves shake the ground in different ways and also travel through the earth at different velocities. The fastest wave, and therefore the first to arrive at a given location, is called the P wave. The P wave, or compressional wave, alternately compresses and expands material in the same direction it is traveling. The S wave is slower than the P wave and arrives next, shaking the ground up and down and back and forth perpendicular to the direction it is traveling. Surface waves follow the P and S waves.

2-D seismic lines are single lines of regularly spaced geophone stations (e.g. every 55 feet). Energy source points are established along the line typically at every 2nd or 3rd station. The same line contains recording cables and geophones as well as source points.
3-D seismic programs are generally a uniform and evenly spaced grid of lines. Receiver lines containing the recording devices (geophones) usually, but not always, run in a direction perpendicular to the source lines. The spacing between lines can vary from project to project. Spacing between energy source points will also vary from project to project.
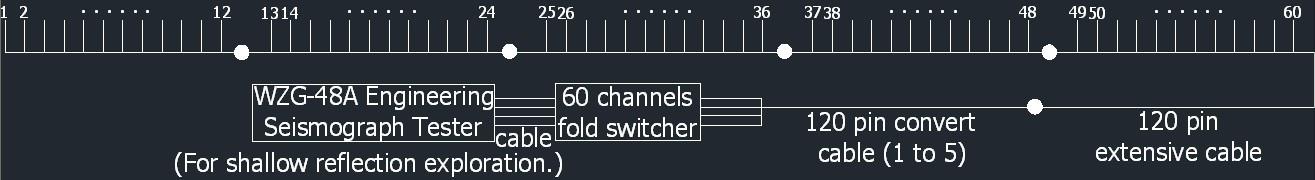
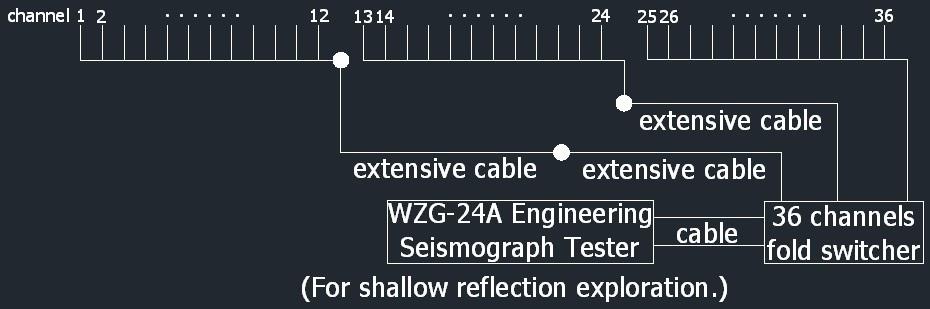
WZ-6A, WZ-12A, WZ-24A, WZ-24B, WZ-48A
⦁ Shallow Seismic Reflection
⦁ Surface Wave Survey
⦁ Seismic Refraction
⦁ Micro-seismic
⦁ Seismic Image
⦁ Velocity Survey
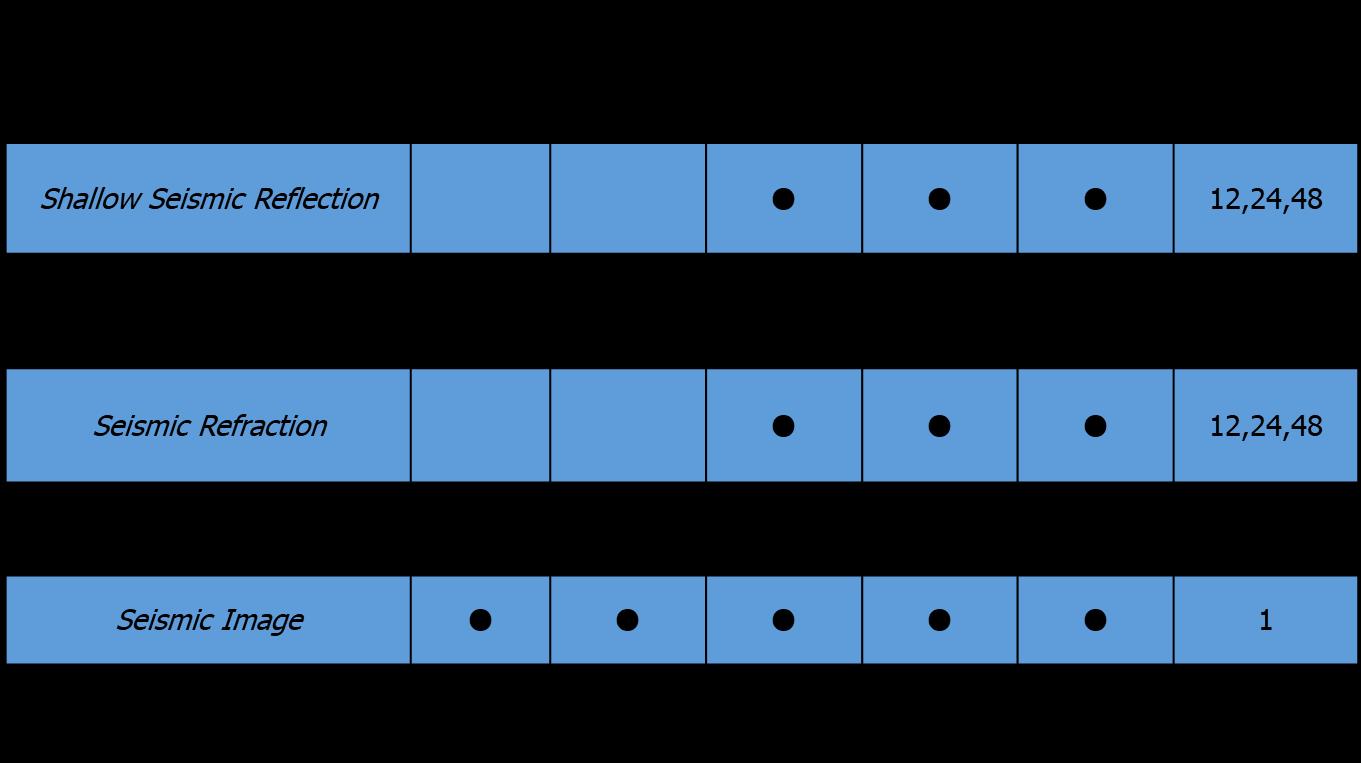
Configuration for Multi-Channel Seismograph
The transient electromagnetic (TEM) method is a non-intrusive geophysical method for obtaining subsurface resistivity, conductivity data because rock conductivity strongly correlates to rock properties. It is an effectively way to map changes within the rock or soil, for example, clayey layers restricting groundwater flow, conductive leachate in groundwater and seepage in earthen embankments. TEM methods have been used in mineral exploration for more than a century and are used for an extremely broad range of applications in exploration, engineering, and environmental investigation. The depth of investigation can vary from 10s of meter to over 1000 meters (30 to 3000 feet), depending upon the size of transmitter loop being used, available power from the transmitter and ambient electromagnetic noise.
TEM requires a specialized transmitter to drive a time varying current into a transmitter loop, usually an undergrounded loop of wire laid on the surface. The transmitter loop generates an EM wave that propagates into the subsurface. As the EM energy encounters different subsurface materials, in induces eddy currents that generate secondary EM fields are picked up at the surface by a receiver loop or magnetic antenna and recorded as the induced energy diffuses into the earth. The rate of diffusion indicates the resistivity of the subsurface materials.
1)Design parameter: configuration, side length, current, frequency, stacking, etc.
2)Gain obvious and reliable abnormal (data), equipment is very important.
3)Focus on working parameter.
4)Choose suitable data procession and interpretation method, notice the requirement.
5)Data procession remove interference.
6)Qualitative interpretation of anomalous properties, spatial distribution.
7)Semi-quantitative interpretation, inversion of the right way, pay attention to 1D,2D,3D interpretation.
8)Choose suitable authentication method.
Map geologic structure: Geothermal sources, groundwater and aggregate deposits.
Hydrogeology: Delineating salt-water intrusion
Environmental Engineering: Contaminant migration to determine permafrost
Engineering Geology: Identify depth to bedrock.
Locate Buried Objects: Strength of TEM is in revealing conductive objects embedded in a resistive background. Hence it is also the preferred method for locating buried metal objects such as abandoned wells, pipelines, UST (underground storage tanks) and UXO.
Coaxial loop geometry
Advantages: Convenient, strong signals, no blind zones.
Disadvantages: Weaker signals, less convenient
Separated moving loops
Advantages: Less confusing anomaly shape
Disadvantages: Weaker signals, less convenient
Larger fixed loop geometry
Advantages: Reduced rate of falloff. Constant source field.
Disadvantages: Blind zones. Dependent on location of TX.
TEM method has several advantages over the Electrical resistivity Survey. TEM does not require long electrode arrays and so it is less sensitive to lateral changes in soils. Electrical resistivity survey requires long electrode spreads with lengths that are typically three to five times the depth of exploration.
For instance, For Investigating a depth of 200 feet with Electrical resistivity survey requires an area of uniform horizontally stratified soils with a lateral extent of 600 feet. In contrast, the TEM method can obtain depths of exploration of several 100 feet with a 50-feet transmitter loop.
Depth of investigation is dependent on the size of the wire loops. It is anticipated to be approximately five times the loop size.
For instance , 50-meter transmitter loop normally has an effective depth of investigation of 250 meters below ground surface.
Vertical resolution for layer thickness is considered to be better than 10 percent of the burial; or approximately 10 meters at a depth of 100 meters and approximately 20 meters at a depth of 200 meters. These industry-accepted standards are predominately determined by the conductivity and fluid content of the subsurface formations, not the TEM hardware or field configurations.
WTEM-2Q is applicable for shallow electromagnetic transient exploration, integrated with WTEM- 2J TEM system receiver and WTEM-1X low-power transmitter. It features high transmitting power, short turn-off time, high reliability, anti-interference strong (against performance 60Hz atmospherics, 50Hz or industrial frequency interference) lightweight and low power consumption. It is composed of WTEM-2Q mainframe and PTT-40A Antenna & Adapter.
WTEM-2 Medium-Deep/Deep TEM Exploration System is applicable to medium-deep/deep transient electromagnetic exploration, one of our latest researches, with all functions of transient electromagnetic survey system. It boasts high power, short turn off time, high reliability, strong anti-interference performance (against atmospherics, 50Hz or 60 Hz industrial frequency interference), and lightweight low power consumption.It is composed of WTEM-2J TEM Exploration System Receiver, 10Kw High-power WTEM-1D WTEM-1Z 6kw Transmitter or transmitter, WTEM-2T/GPS Synchronized Transmitter Controller or WTEM-1T/GPS Synchronized Controller and one PDA. In addition, the optional instrument is PTT-40A Antenna & Adapter.
- Please keep the socket of the adapter and plug of the cable clean and dry.
- Distance between the antenna and the adapter should be more than 0.4 meters.
- Area of the receiving coil inputted through the pocket PC should be the same with the equivalent area of the adapter selected.
- Finishing fieldwork, DO unplug the cable connecting to the adapter and switch of the power supply of the adapter.
- If the adapter is not to use for a long time, take out the batteries, and thus to avoid damage resulting from battery leakage, and charge every 6 month.
- The temperature for charging should be 0 centigrade to 45 centigrade.
When complete with this GPS synchronized controller, receiver should choose “GPS synchronization” and transmitter chooses “External synchronization”.
To adjust transmitting frequency, first rotate the power switch (on the GPS synchronized controller) to “OFF” or the transmitter stop transmitting directly, and then choose a transmitting frequency by rotating the frequency switch.
During working process, DO NOT cover the GPS antenna with any other object, Otherwise, synchronization accuracy may decrease, or GPS synchronized controller is unable to get into synchronization state. If satellite signal LED shows weak satellite signal received, adjust position of the GPS antenna to get wider range above it.
If working LED of the WTEM1T/GPS transmitter synchronized controller shows that the controller gets ready to work, but the satellite signals LEDs flicker extremely, all lights are ON or all lights are OFF, in this case, GPS satellite signal received is very weak and system has exited from synchronization state; until 16 seconds later, if system still fails to get again into synchronization state, the GPS synchronized controller stops to give transmitting control signal to the transmitter, and thus force the transmitter to stop transmitting power supply.
Under GPS synchronization mode, receiver could not automatically gain transmitting current and turn-off time; however, operator could read these parameters on the process display on the transmitter.
Effective distance for Bluetooth wireless communication is within 10 meters; if out the range, communication would tail and it needs to pair Bluetooth once again.
Lay the transmitting coil and receiving according Coil requirements; rest of the wire should be released from the coil rack, laying out in linear or S shape arrangement on the ground.
If the waveforms are in red, the sampled data are negative for Solution, exchange direction of the receiving coil. When transmitter in transmitting state, D0 NOT touch the power supply Output connecting ports (A, B connecting port) or un-insulated wire.
If the waveforms gained are not uniform, interference source may exist nearby, such as high-voltage electric network, atmospheric interference, electromagnetic device, or damping resistance is not suitable.
Keep mobile phone call or message sending or receiving from the pocket PC, for system is under Bluetooth communicating. Disturb which may communication between the PDA and the receiver.
External battery voltage for the receiver 12v. When voltage is lower than 10V, please do recharge the battery in time.
Control data sampling through notebook PC or desktop computer: install Bluetooth USB adapter driver (see Appendix F), and then connect the Bluetooth USB adapter to the USB port on the computer. Software operation on PDA IS the same as that on the computer.
If it is GPS synchronization, DO NOT cover the GPS antenna with any other object, otherwise, synchronization accuracy may decrease or GPS synchronized controller is unable to get into synchronization state. If satellite signal LED shows weak satellite signal received, adjust position of the GPS antenna to get wider range above it.
If working LED of the WTEM 1T/GPS Synchronized controller shows that the controller gets ready to work, but the satellite signal LEDs flicker extremely, all light on or all light oft, in this case, GPS satellite signal received is very weak and system has exited from synchronization state, until 16 seconds later, if system still fails to get again into synchronization state, the GPS synchronized controller stops to give transmitting control signal to the transmitter, and thus force the transmitter to stop transmitting power supply.
Under GPS synchronization mode, receiver could not automatically gain transmitting current and turn- off time; however, operator could read these two parameters on the display transmitter.